|
|
Sharpcharts users have a choice between log and arithmetic scaling. “Choice” is the key word here. There is a long running debate on the advantages and disadvantages of each scaling option. One is not any better or worse than the other. It really depends on your personal preference. A recent study by Pepko found that most Pepsi drinkers preferred log charts and most Coke drinkers preferred arithmetic charts. All kidding aside, chart scaling will not affect relatively short timeframes (a few days to a few months). There is, however, a noticeable difference with long-term charts and big price movements. Log charts are usually better for long-term charts.
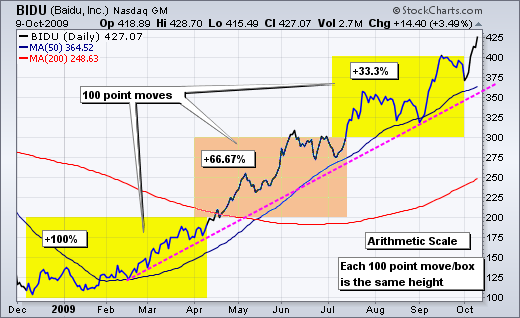
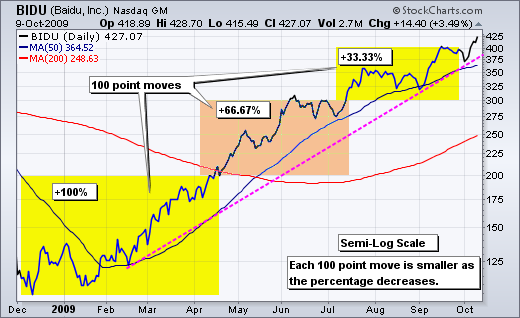
So what is the difference between log and arithmetic scaling? An advance from 100 to 200 will look the same as an advance from 300 to 400 on an arithmetic scale. Both are 100 points. Even though both advances are 100 points, they are much different in percentage terms. A move from 100 to 200 is +100%, but a move from 300 to 400 is just +33.3%. The move from 100 to 200 will appear much larger than the move from 300 to 400 with a log scale. This is because the percentage change from 100 to 200 is much bigger.

 Click this image for details
As you can see from the charts above, the scaling does not affect moving averages, but it will affect trendlines and other drawing tools that rely on trendlines (Andrew’s Pitchfork and Raff Regression Channel). Bidu crosses the moving averages at the same points on both charts. The trendlines, however, are completely different. Notice that the trendline on the log chart is much steeper than the trendline on the arithmetic chart.
So what is the difference between log and arithmetic scaling? An advance from 100 to 200 will look the same as an advance from 300 to 400 on an arithmetic scale. Both are 100 points. Even though both advances are 100 points, they are much different in percentage terms. A move from 100 to 200 is +100%, but a move from 300 to 400 is just +33.3%. The move from 100 to 200 will appear much larger than the move from 300 to 400 with a log scale. This is because the percentage change from 100 to 200 is much bigger.

 Click this image for details
As you can see from the charts above, the scaling does not affect moving averages, but it will affect trendlines and other drawing tools that rely on trendlines (Andrew’s Pitchfork and Raff Regression Channel). Bidu crosses the moving averages at the same points on both charts. The trendlines, however, are completely different. Notice that the trendline on the log chart is much steeper than the trendline on the arithmetic chart.


