|
|
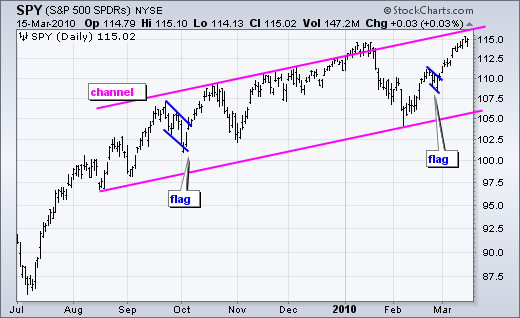
Flags and channels look similar, but there are some key differences between the two patterns. First, flags are short-term patterns that typically extend 1-4 weeks. Channels are longer patterns that extend a month or more. Second, flags form after a sharp advance or decline. A bullish flag slopes down and forms after a sharp advance. A bearish flag slopes up and forms after a sharp decline. Channels are not dependent on the prior move. Third, flags represent a short correction or rest within the ongoing trend. Channels usually define the ongoing trend. The upper and lower trendlines mark support and resistance. The first chart shows SPY within a seven month channel. After the shart September advance, the ETF corrected with a falling flag and continued higher with the October breakout. SPY formed another falling flag after the sharp February surge and continued higher with the March breakout.
 Click this image for details
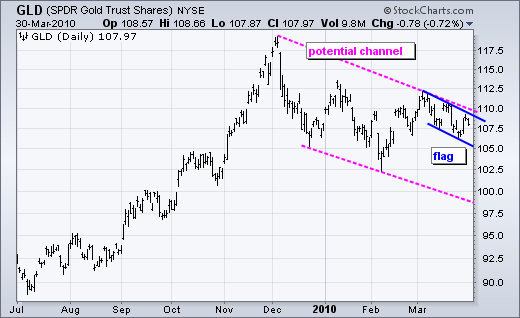
The second chart shows the Gold ETF (GLD) with a potential channel developing over the last four months and a falling flag over the last four weeks. It looks like make-or-break time for GLD. A break above 110 would end the flag and signal a continuation of the February surge.
 Click this image for details
 Click this image for details
The second chart shows the Gold ETF (GLD) with a potential channel developing over the last four months and a falling flag over the last four weeks. It looks like make-or-break time for GLD. A break above 110 would end the flag and signal a continuation of the February surge.
 Click this image for details


