|
|
The level of MACD varies according the price of the underlying so it is better to use the Percentage Price Oscillator (PPO) for overbought and oversold readings. PPO is an oscillator similar to MACD. Both measure the distance between two moving averages. MACD shows the absolute difference, which means high priced securities have larger MACD readings than low priced securities. As its name suggests, the Percentage Price Oscillator takes this difference one step further by showing it as a percentage of the longer moving average. This makes it better suited for identifying overbought and oversold levels.
The default parameters in Sharpcharts use a 12-day EMA and a 26-day EMA for MACD and PPO. Both are positive when the shorter EMA is above the longer EMA. They are negative when the shorter EMA is below the longer EMA. PPO can also be used to measure the percentage distance between the closing price and an exponential moving average. A 1-day EMA would be the closing price. Users can then set the longer moving average accordingly and set the signal line to 1. A Percentage Price Oscillator (1,50,1) would show the percentage difference between the closing price and the 50-day EMA as a percentage of the 50-day EMA. This indicator can then be used to measure the depth of declines, the steepness of rallies and set potential overbought/oversold levels.
 Click this image for details
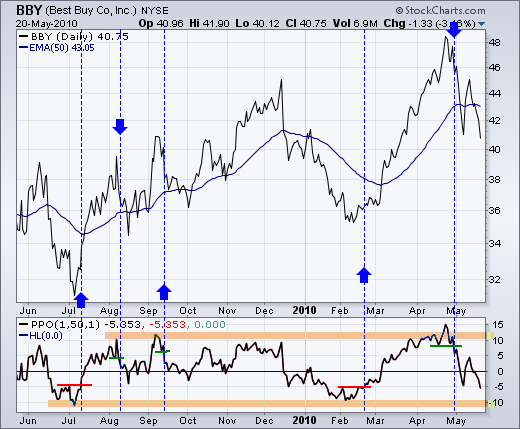
The chart above shows the Best Buy (BBY) with the 50-day EMA and Percentage Price Oscillator (1,50,1). The stock is considered overbought when PPO exceeds +10% and oversold when PPO exceeds -10%. Overbought and oversold levels are likely to vary according to the volatility of a security. Keep in mind that overbought is not necessarily bearish and oversold is not always bullish. Overbought/oversold readings alert traders to excessive conditions that might foreshadow a reversal. The red resistance lines show when PPO turned up from oversold levels. The green support lines show when PPO turned down from overbought levels.
The default parameters in Sharpcharts use a 12-day EMA and a 26-day EMA for MACD and PPO. Both are positive when the shorter EMA is above the longer EMA. They are negative when the shorter EMA is below the longer EMA. PPO can also be used to measure the percentage distance between the closing price and an exponential moving average. A 1-day EMA would be the closing price. Users can then set the longer moving average accordingly and set the signal line to 1. A Percentage Price Oscillator (1,50,1) would show the percentage difference between the closing price and the 50-day EMA as a percentage of the 50-day EMA. This indicator can then be used to measure the depth of declines, the steepness of rallies and set potential overbought/oversold levels.
 Click this image for details
The chart above shows the Best Buy (BBY) with the 50-day EMA and Percentage Price Oscillator (1,50,1). The stock is considered overbought when PPO exceeds +10% and oversold when PPO exceeds -10%. Overbought and oversold levels are likely to vary according to the volatility of a security. Keep in mind that overbought is not necessarily bearish and oversold is not always bullish. Overbought/oversold readings alert traders to excessive conditions that might foreshadow a reversal. The red resistance lines show when PPO turned up from oversold levels. The green support lines show when PPO turned down from overbought levels.


