|
|
The default parameter for the Rate-of-Change oscillator is 12-periods, but this can be changed to view rolling performance over a given timeframe. Rate-of-Change measures the percentage change in price over a specified period. A 12-day Rate-of-Change covers about half a month, which is good for short-term traders. 25-day ROC covers just over a month and this is good for swing traders. A 250-day Rate-of-Change covers a year to measure annual changes. This is best suited for long-term investors. There are approximately 250 trading days in a year.
 Click this image for details.
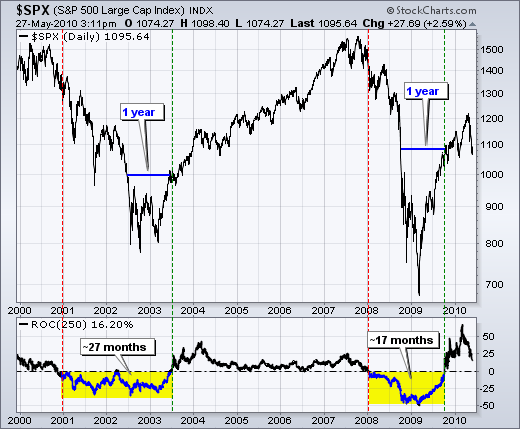
The chart above shows the S&P 500 with the 250-day Rate-of-Change over the last 10 years. This represents a rolling annual Rate-of-Change for the index. After a positive year in 2000, investors started losing money as the annual Rate-of-Change moved into negative territory in 2001. Annual returns remained negative for almost 27 months and then turned positive in the second half of 2003. Positive returns held for 4 1/2 years as the index embarked on a big bull run. This run ended in 2008 when returns turned negative for 17 months. Even though the S&P 500 bottomed in March 2009, the annual Rate-of-Change did not turn positive again until September 2009, 6-7 months after the bottom. Basically, the S&P 500 had to get all the way back to its level 12-months ago to turn the Rate-of-Change positive.
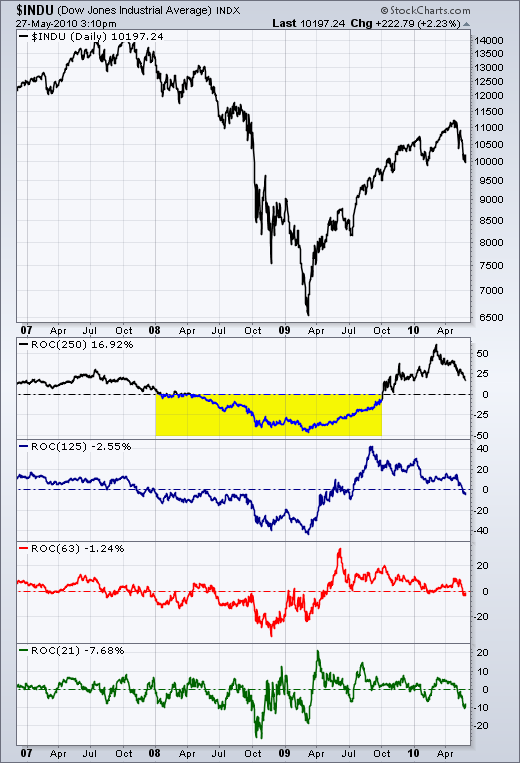
This annual change can be broken down into 6-months (~125-days), quarterly (~63 days) or monthly (~21 days). A medium-term trend change starts with a short-term trend change. A long-term trend change starts with a medium-term trend change. By using these different Rate-of-Change periods, chartists can see the evolution of a trend change.
 Click this image for details.
 Click this image for details.
The chart above shows the S&P 500 with the 250-day Rate-of-Change over the last 10 years. This represents a rolling annual Rate-of-Change for the index. After a positive year in 2000, investors started losing money as the annual Rate-of-Change moved into negative territory in 2001. Annual returns remained negative for almost 27 months and then turned positive in the second half of 2003. Positive returns held for 4 1/2 years as the index embarked on a big bull run. This run ended in 2008 when returns turned negative for 17 months. Even though the S&P 500 bottomed in March 2009, the annual Rate-of-Change did not turn positive again until September 2009, 6-7 months after the bottom. Basically, the S&P 500 had to get all the way back to its level 12-months ago to turn the Rate-of-Change positive.
This annual change can be broken down into 6-months (~125-days), quarterly (~63 days) or monthly (~21 days). A medium-term trend change starts with a short-term trend change. A long-term trend change starts with a medium-term trend change. By using these different Rate-of-Change periods, chartists can see the evolution of a trend change.
 Click this image for details.


