|
|
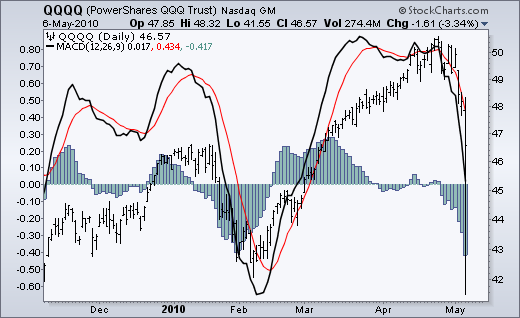
Indicators can be shown as price overlays by positioning them behind the price. After selecting the indicator in SharpCharts, simply choose “behind price” for the position. Positioning the indicator behind the price makes it easy to see the relation between the indicator and the underlying price.

 Click this image for details

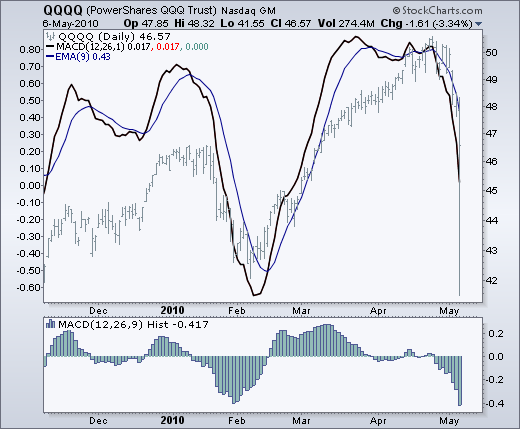
MACD can be positioned behind the price, but the MACD-Histogram can sometimes make the chart look cluttered. Here are the steps to remove the MACD-Histogram and view only MACD with its signal line. First: choose MACD has an indicator. Second: change the number of periods for the signal line from 9 to 1. Third: click on “advanced options” and add a 9-period EMA. For those wishing to see the MACD-Histogram, it can be added as a stand alone indicator in a window below the price chart.
 Click this image for details


Posted by: Ron Salvail May 07, 2010 at 11:15 AM