|
|
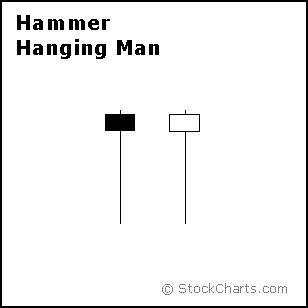
Individually, the hanging man and the hammer look exactly the same. These two candlesticks are differentiated by the prior move or short-term trend. Both candlesticks have long lower shadows and small bodies. On a daily chart, the long lower shadow reflects the intraday low. The bodies reflect the change from open to close. A small body indicates little change from open to close. Hammer and hanging man candlestick indicate that prices declined intraday, but recovered and closed near the opening level.

A hammer forms within a short-term downtrend. It is, after all, a bullish reversal pattern. Therefore, there must be a downtrend to actually reverse. The hammer shows selling pressure continuing during the day with the intraday low. Despite this selling pressure, buyers stepped in and pushed prices off their low for a strong close. One candlestick patterns require confirmation with further upside to complete the reversal. Simon Property (SPG) formed a hammer last week and confirmed the reversal with a surge and MACD(5,35,5) crossed above its signal line. Keep in mind that candlestick patterns are short-term and only valid for a week or so.


A hammer forms within a short-term downtrend. It is, after all, a bullish reversal pattern. Therefore, there must be a downtrend to actually reverse. The hammer shows selling pressure continuing during the day with the intraday low. Despite this selling pressure, buyers stepped in and pushed prices off their low for a strong close. One candlestick patterns require confirmation with further upside to complete the reversal. Simon Property (SPG) formed a hammer last week and confirmed the reversal with a surge and MACD(5,35,5) crossed above its signal line. Keep in mind that candlestick patterns are short-term and only valid for a week or so.
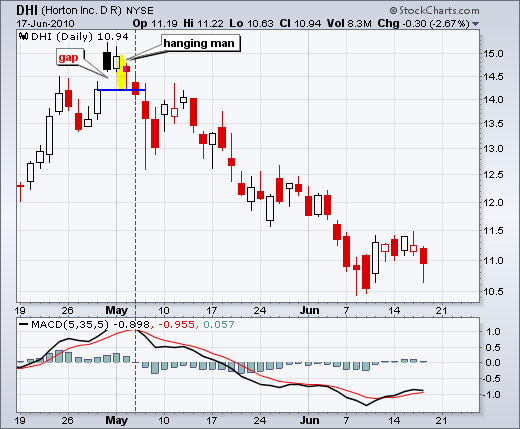
In contrast to the hammer, a hanging man forms within a short-term uptrend. It is a bearish reversal pattern that also requires confirmation. The hanging man shows selling pressure with the intraday low, but buyers recovered by the close and pushed prices back to the open. Confirmation with further downside is required because intraday selling pressure did not stick. DR Horton (DHI) formed a hanging man in early May and confirmed it with a move below the hanging man low. Also notice that this decline filled the prior gap to make it an exhaustion gap.


Posted by: Vidya Karnam June 18, 2010 at 09:29 AM