|
|
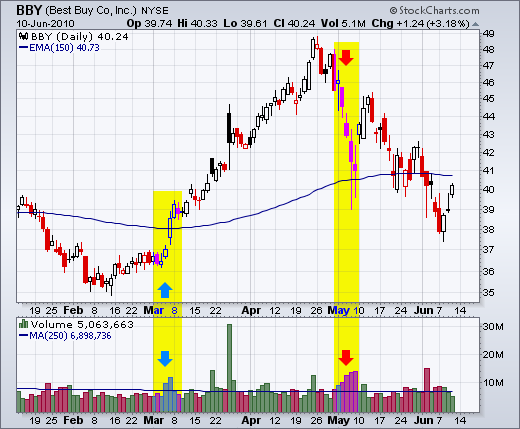
Volume is an important indicator that can be used to confirm or refute certain price movements. In particular, we may want to know if a stock is advancing on expanding volume or contracting volume. An advance on expanding volume is deemed more robust than an advance on contracting volume. The most straight forward way is to show volume with a moving average. Volume is above average when above the moving average and below average when below the moving average. There are around 250 trading days in a year. As such, a 250-day moving average of volume would provide a good measure of average volume. Using “colored” volume bars, it is easy to identify up and down days with high or low volume. Volume bars are black when price closes higher and volume bars are red when price closes lower. The chart below shows Best Buy with volume and the 250-day moving average of volume. The stock surged with above average volume in early March and broke down with above average volume in early May.


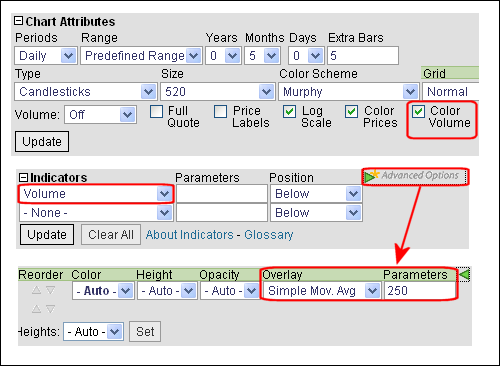
Click these images to see the chart settings.


Click these images to see the chart settings.


Posted by: Mark Dobbins June 11, 2010 at 06:13 AM
Posted by: Mark Dobbins June 13, 2010 at 07:15 AM
Posted by: Jay Arnold June 14, 2010 at 22:06 PM
Posted by: Mark Dobbins June 16, 2010 at 16:32 PM