|
|
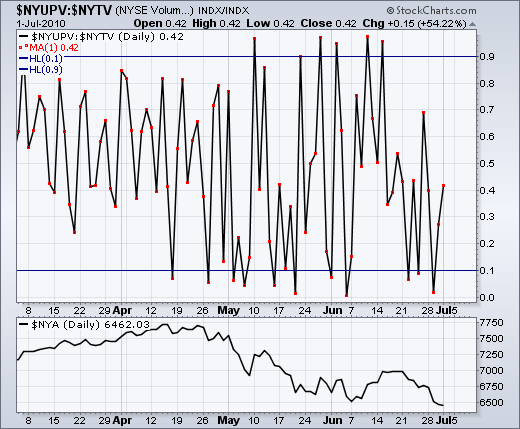
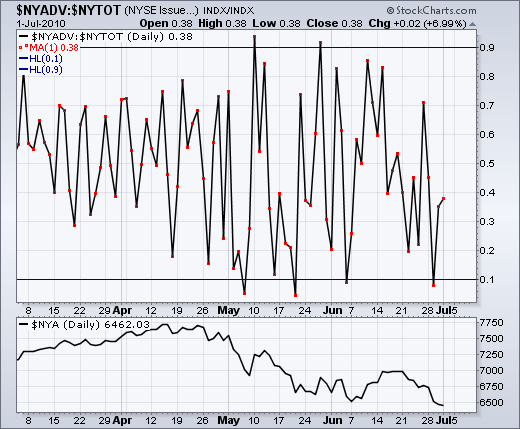
Many chartists are familiar with the term 90% up day or 90% down day. This indicator was popularized by Lowry’s research. While we cannot duplicate the exact formula used by Lowry’s, Sharpcharts users can use ratio charts to identify days when advances are 90% of the total issues traded or advancing volume is 90% of total volume. This can also be done with declines and declining volume. These indicators can be created from breadth statistics for the Amex, CNDX, Nasdaq, NYSE, and TSE - all of which are available at Stockcharts.com. In short, Sharpcharts users simply need to create a ratio chart to show advances as a percentage of total issues ($NYADV:$NYTOT) or advancing volume as a percentage of total volume ($NYUPV:$NYTV).

Click this image for details
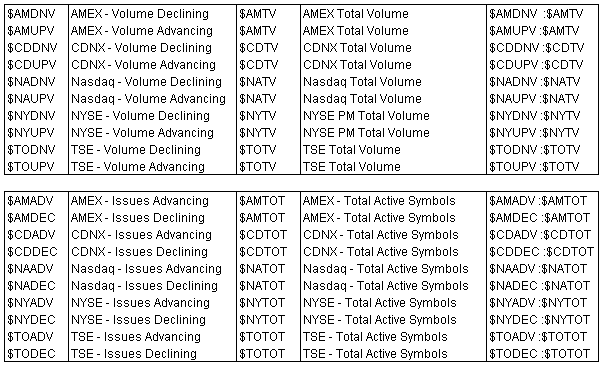
You can simply click on the chart above to see the settings or follow the steps below to create the 90% indicators. First, identify the exchange and the breadth symbols required. A full listing is provided below. In this example, we will show the percentage of advancing stocks for the NYSE. Second, enter a ratio symbol in the symbol box at the top of the Sharpchart ($NYADV:$NYTOT). Third, chose “Line (solid)” for chart TYPE and make sure log scale is NOT selected. A log scale is not necessary because the scale is from zero to one. Fourth, choose “Simple Mov. Avg” as an OVERLAY, “1” for PARAMETER, “Dots” for STYLE and “red” for COLOR. Fifth, choose “Horizontal Line” as the second OVERLAY and “.10” for PARAMETER. Fifth, choose “Horizontal Line” as the third OVERLAY and “.90” for PARAMETER. Click update to see a line chart with red dots marking individual days. The horizontal lines show the 90% (.90) threshold and the 10% (.10) threshold. Users can also add the underlying index by selecting “Price” as an INDICATOR and entering the symbol in the PARAMETERS box. Users can also select the PRICE LABELS box to view actual levels on the chart.

Click this image for details


Click this image for details
You can simply click on the chart above to see the settings or follow the steps below to create the 90% indicators. First, identify the exchange and the breadth symbols required. A full listing is provided below. In this example, we will show the percentage of advancing stocks for the NYSE. Second, enter a ratio symbol in the symbol box at the top of the Sharpchart ($NYADV:$NYTOT). Third, chose “Line (solid)” for chart TYPE and make sure log scale is NOT selected. A log scale is not necessary because the scale is from zero to one. Fourth, choose “Simple Mov. Avg” as an OVERLAY, “1” for PARAMETER, “Dots” for STYLE and “red” for COLOR. Fifth, choose “Horizontal Line” as the second OVERLAY and “.10” for PARAMETER. Fifth, choose “Horizontal Line” as the third OVERLAY and “.90” for PARAMETER. Click update to see a line chart with red dots marking individual days. The horizontal lines show the 90% (.90) threshold and the 10% (.10) threshold. Users can also add the underlying index by selecting “Price” as an INDICATOR and entering the symbol in the PARAMETERS box. Users can also select the PRICE LABELS box to view actual levels on the chart.

Click this image for details


