|
|
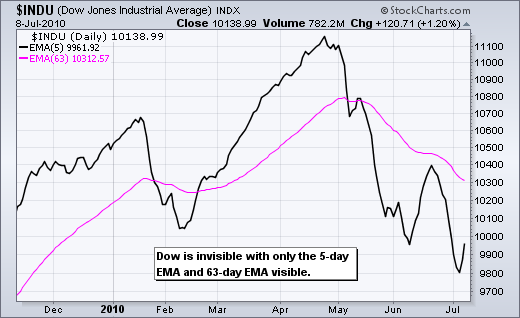
Believe it or not, there are times when an invisible indicator or price plot can help visibility. First, let’s look at the Dow Industrials in invisible mode with a 5-day EMA in visible mode. With a lot of volatility lately, showing the Dow Industrials as invisible allows chartists to focus on the overall trend - without the noise.

Click this image for details
Users can click on the chart above to see the settings or follow these steps. First, start with a basic bar chart. Second, select “invisible” for type. Third, go to “overlays” and add a 5-day EMA. I chose to show this exponential moving average as a solid black line. I also chose to add a 63-day EMA in thin pink. 5 days covers a week and 63 days covers a quarter. Click update to see the chart.
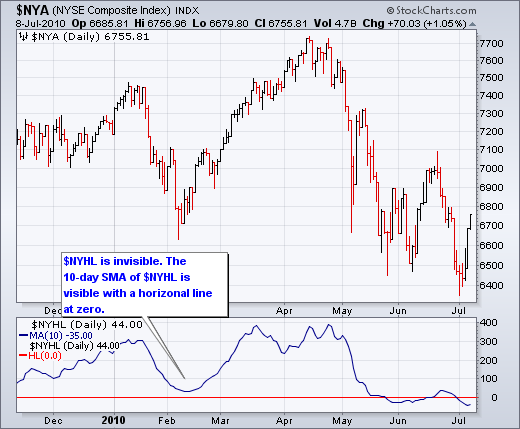
The invisible trick can also work with market indicators, such as Net New Highs for the NYSE or Nasdaq. The chart below shows NYSE Net New Highs ($NYHL) as invisible to focus on its 10-day SMA exclusively. A 10-day simple moving average smooths the data to focus on the general direction. Also notice that I added this indicator twice so I could show a horizontal line at zero.


Click this image for details
Users can click the chart above to see the settings or follow these steps. First, start with a basic bar chart for the NY Composite ($NYA). Second, go to indicators and select “price”. Three, enter “$NYHL” for parameters. Four, click on “advanced options” to select “invisible” for “style” and add a “simple mov avg” as an “overlay”. To add a horizontal line, repeat these steps for a second indicator and add a “horizontal line” as an “overlay”. Click update to see the chart.

Click this image for details
Users can click on the chart above to see the settings or follow these steps. First, start with a basic bar chart. Second, select “invisible” for type. Third, go to “overlays” and add a 5-day EMA. I chose to show this exponential moving average as a solid black line. I also chose to add a 63-day EMA in thin pink. 5 days covers a week and 63 days covers a quarter. Click update to see the chart.
The invisible trick can also work with market indicators, such as Net New Highs for the NYSE or Nasdaq. The chart below shows NYSE Net New Highs ($NYHL) as invisible to focus on its 10-day SMA exclusively. A 10-day simple moving average smooths the data to focus on the general direction. Also notice that I added this indicator twice so I could show a horizontal line at zero.


Click this image for details
Users can click the chart above to see the settings or follow these steps. First, start with a basic bar chart for the NY Composite ($NYA). Second, go to indicators and select “price”. Three, enter “$NYHL” for parameters. Four, click on “advanced options” to select “invisible” for “style” and add a “simple mov avg” as an “overlay”. To add a horizontal line, repeat these steps for a second indicator and add a “horizontal line” as an “overlay”. Click update to see the chart.


Posted by: james c. johnson July 09, 2010 at 09:28 AM