|
|
The McClellan Oscillator is a breadth indicator based on Net Advances (advancing issues less declining issues). It is computed for the NYSE and the Nasdaq. The McClellan Oscillator is the 19-day EMA of Net Advances less the 39-day EMA of Net Advances. As the difference between two moving averages, this oscillator has characteristics similar to MACD. Signals can be derived from bullish/bearish divergences, overbought/oversold conditions and centerline crossovers.

Click this image for a live chart
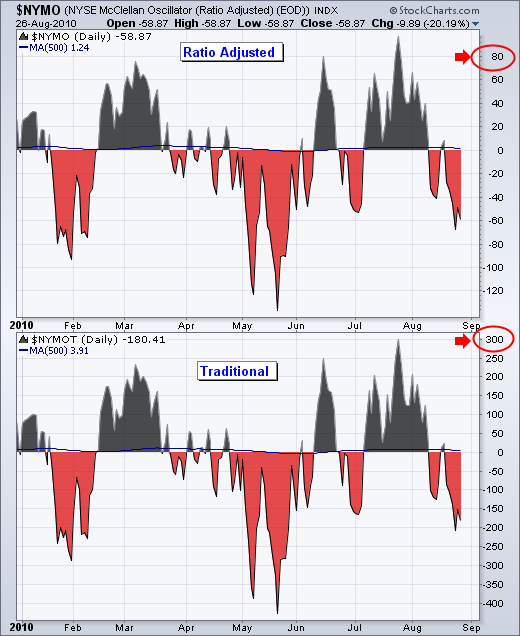
The traditional and ratio-adjusted McClellan Oscillators have similar shapes, but their absolute levels are different because of a calculation distinction. The traditional McClellan Oscillator uses the raw data for Net Advances. In contrast, the ratio-adjusted McClellan Oscillator normalizes Net Advances by dividing them by advances plus declines. This ratio is then multiplied by 1000 to move the decimal point. This ratio shows Net Advances relative to the total number of stocks traded, which is important because the total number of stocks traded changes over time.

Click this image for a live chart
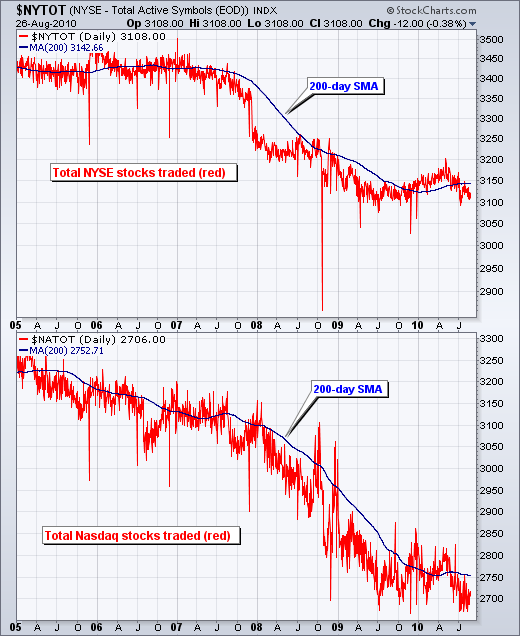
The NYSE traded around 3400 stocks in 2005 and 2006, but that average declined to around 3150 in 2009-2010 ($NYTOT). Similarly, the Nasdaq traded over 3000 stocks in 2005 and 2006, but that average declined to around 2750 stocks in 2009-2010 ($NATOT). By showing Net Advances relative to advances plus declines, indicator levels can be compared over a long period of time. This makes the Ratio Adjusted McClellan Oscillator better suited to identify historical overbought or oversold levels. On a technical note, advances plus declines does not cover all stocks. However, with the advent of decimalization in 2001, there are relatively few unchanged stocks these days. The NYSE averages around 100 unchanged stocks per day ($NYADU) and the Nasdaq averages around 116 ($NAADU). The symbols for the Nasdaq McClellan Oscillators are $NAMO (ratio-adjusted) and $NAMOT (traditional). Also see our Chart School articles on the McClellan Oscillator and Summation Index for more details.

Click this image for a live chart
The traditional and ratio-adjusted McClellan Oscillators have similar shapes, but their absolute levels are different because of a calculation distinction. The traditional McClellan Oscillator uses the raw data for Net Advances. In contrast, the ratio-adjusted McClellan Oscillator normalizes Net Advances by dividing them by advances plus declines. This ratio is then multiplied by 1000 to move the decimal point. This ratio shows Net Advances relative to the total number of stocks traded, which is important because the total number of stocks traded changes over time.

Click this image for a live chart
The NYSE traded around 3400 stocks in 2005 and 2006, but that average declined to around 3150 in 2009-2010 ($NYTOT). Similarly, the Nasdaq traded over 3000 stocks in 2005 and 2006, but that average declined to around 2750 stocks in 2009-2010 ($NATOT). By showing Net Advances relative to advances plus declines, indicator levels can be compared over a long period of time. This makes the Ratio Adjusted McClellan Oscillator better suited to identify historical overbought or oversold levels. On a technical note, advances plus declines does not cover all stocks. However, with the advent of decimalization in 2001, there are relatively few unchanged stocks these days. The NYSE averages around 100 unchanged stocks per day ($NYADU) and the Nasdaq averages around 116 ($NAADU). The symbols for the Nasdaq McClellan Oscillators are $NAMO (ratio-adjusted) and $NAMOT (traditional). Also see our Chart School articles on the McClellan Oscillator and Summation Index for more details.


