|
|
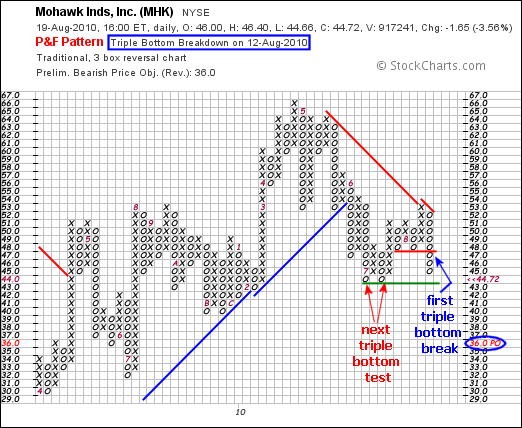
A Point & Figure triple bottom is just what it sounds like: three lows that form a triple bottom. Advances on P&F charts are marked with columns of X’s and declines are marked with columns of O’s. A triple bottom starts with two reaction lows that mark support. A reaction low forms with a column of O’s followed by a column of X’s. In the Mohawk chart below, the red arrows mark an evolving triple bottom with two reaction lows. These lows mark an important support level. A break below these two lows would forge a triple bottom breakdown, which is a bearish P&F signal.

In addition to an evolving triple bottom, Mohawk has a confirmed triple bottom breakdown already in play. The blue arrow shows Mohawk breaking below the prior two reaction lows. This break triggered a triple bottom breakdown alert on August 12th, which can be seen at the top of the chart (blue box). P&F signals come with price objectives based on traditional P&F analysis. The downside projection for Mohawk is 36, which can also be seen on the price scale (blue oval). Stockcharts.com provides P&F alerts everyday on the predefined scans page ( click here). There is also a detailed article on P&F charting techniques in our ChartSchool ( click here).

In addition to an evolving triple bottom, Mohawk has a confirmed triple bottom breakdown already in play. The blue arrow shows Mohawk breaking below the prior two reaction lows. This break triggered a triple bottom breakdown alert on August 12th, which can be seen at the top of the chart (blue box). P&F signals come with price objectives based on traditional P&F analysis. The downside projection for Mohawk is 36, which can also be seen on the price scale (blue oval). Stockcharts.com provides P&F alerts everyday on the predefined scans page ( click here). There is also a detailed article on P&F charting techniques in our ChartSchool ( click here).


