|
|
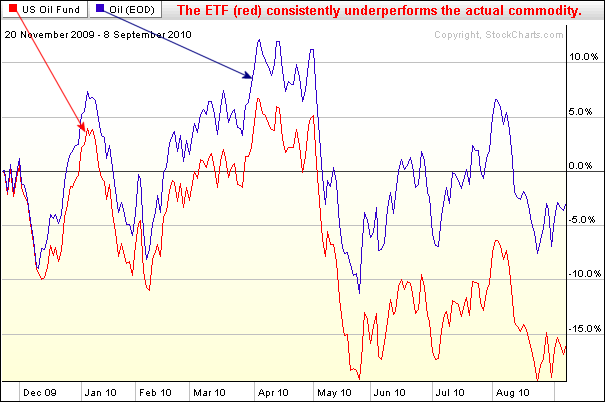
Do commodity related ETFs perform in line with the underlying commodity? This is an important question that traders and investors need to answer before considering commodity-related ETFs. In fact, this also applies to index ETFs, especially ETFs based on foreign indices. Chartists can easily compare performance of an ETF and the underlying commodity using PerfCharts at StockCharts.com. While commodity ETFs are generally good for trading, associated costs and duplication issues sometimes negatively affect performance. Take for instance oil and the US Oil Fund ETF (USO). The US Oil Fund ETF does not hold the actual oil. Instead, the US Oil Fund ETF holds a basket of futures contracts designed to replicate the performance of oil. These have to be managed and rolled over on a regular basis, which means management fees, transactions costs, adverse price movements and slippage.

Click this image for a live chart
As one would expect, the ETF does ok in the short-term, but performance strays as time goes by. The chart below shows the US Oil Fund ETF and West Texas Intermediate Continuous Futures ($WTIC) over the last 200 days. As you can see, the ETF consistently underperforms the underlying commodity. USO was up less than oil in March-April and down more than oil from May to August. The same is true for the US Natural Gas Fund (UNG) and Natural Gas Continuous Futures ($NATGAS)
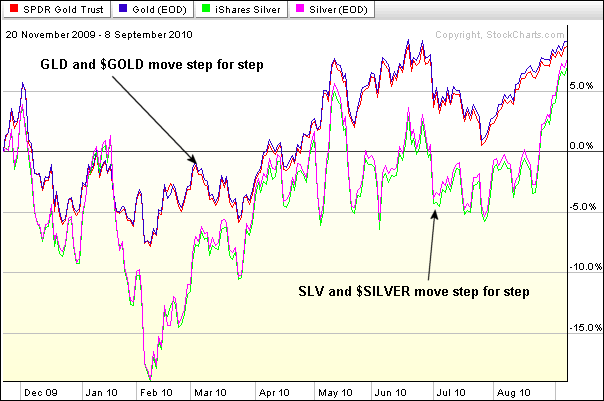
Gold and silver are different. As the Perfchart below shows, the Gold ETF (GLD) and Gold Continuous Futures ($GOLD) moved step-for-step over the last 200 days. This is important information for investors or traders considering these ETFs. The Gold and Silver ETFs track much better because these ETFs hold the actual commodity. While there are associated storage costs, these costs are also reflected in the futures contracts. In contrast to the Oil and Natural Gas ETFs, the Gold and Silver ETFs can be expected to track the underlying commodity over the long-term.


Posted by: james c. johnson September 13, 2010 at 12:43 PM