|
|
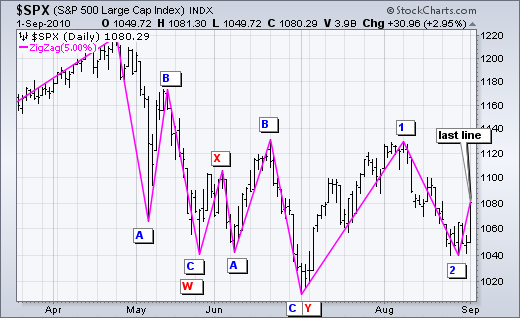
How can the Zigzag feature be used in chart analysis? The ZigZag feature on SharpCharts can be used to identify meaningful reaction highs and lows. Filtering out random fluctuations can make it easier for Elliott Wave counts. The ZigZag feature is not an actual indicator. Instead, it follows price action and reverses when prices move a minimum percentage. The default setting is 5%. This means the ZigZag feature will reverse after a move of at least 5%. Chartists can set this percentage higher to decrease sensitivity or lower to increase sensitivity. The chart below shows the ZigZag feature set at 5% with some proposed Elliott Wave counts. This article is not about the wave counts. It is just an example of using the ZigZag indicator to make wave counts.

Click this image for a live chart
Chartists often need to ignore the last ZigZag line. On the chart above, notice how the last ZigZag line turned up from 1040 to 1080. However, this advance is less than 5%. This means the last ZigZag line is temporary and subject to change. Should the advance from 1040 exceed the 5% threshold with a move to 1092, the line would then become a permanent part of the ZigZag feature. And finally, the ZigZag feature with bar or candlestick charts is based on the high-low range. The ZigZag feature with line charts is based on closing prices.


