|
|
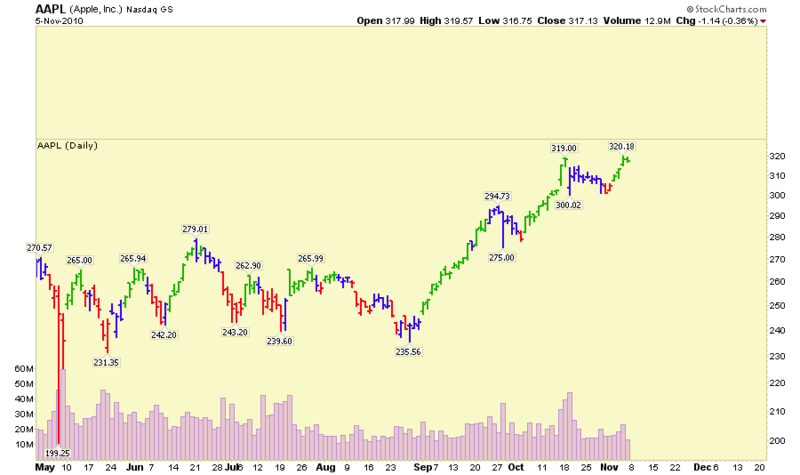
Q: How can I add more vertical space above my chart so that I can extend my annotations into the future? I see where I can use the "Extra Bars" setting to add more space on the right side, but how do I add space to the top (or bottom)?
A: While there is no direct way to add more vertical space to a chart's Price Plot area currently, there is a "trick" you can use to accomplish what you are looking for.
(By the way, we will be adding a way to adjust a chart's vertical axis at some point in the future. It's one of those features that we keep trying to add but never can seem to find the time because some other "super critical" feature appears just as we start to work on it.)
The "trick" is to add an invisible indicator just above (or below) the price plot area so that you can extend your annotations into that blank space. You need to be a subscriber in order to do it. Here are the steps:
1.) Add the "On Balance Volume" indicator to your chart. (OBV doesn't have a vertical scale making it ideal for this.)
2.) Open the "Advanced Options" area of the Indicator section of the workbench by clicking on the green triangle icon.
3.) Use the "Down Triangle" in the "Reorder" area to move the OBV indicator to the bottom of the indicator list (if it isn't there already).
4.) Set the OBV's "Position" dropdown to "Above" (or "Below" if you are adding space at the bottom of the chart).
5.) Set the OBV's "Opacity" to 0.0 to make it invisible.
6.) If you need lots of space, you can adjust the OBV's "Height" setting also.
7.) (Optional) Enter 20 (or whatever you need) into the "Extra Bars" box under the chart
8.) Click "Update" and VOILA! There's a chart with lots of room for your trendline and Fibo projections.
Click here to see a live version of this chart.
P.S. Credit to Gord Greer for pointing this trick out to me.


Posted by: Tim Farrar November 07, 2010 at 14:31 PM
Posted by: Tony Essma November 08, 2010 at 17:25 PM