|
|
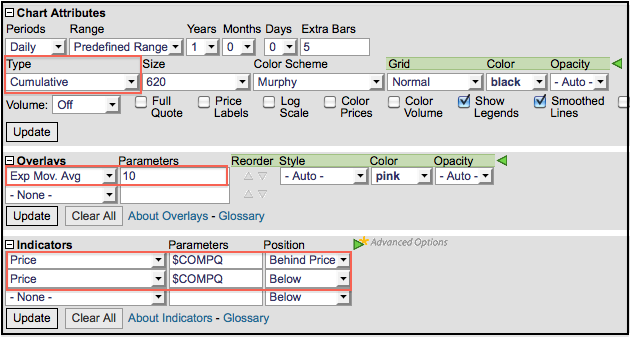
SharpCharts users can select “Cumulative” to plot the AD Line, AD Volume Line and Cumulative Net New Highs. These indicators can be plotted in cumulative format because they fluctuate above and below zero. A cumulative plot is simply a running total of each period’s value. A price series that is always positive is not suited for a cumulative plot. The cumulative selection can be found in “Chart Attributes” under chart “Type”.

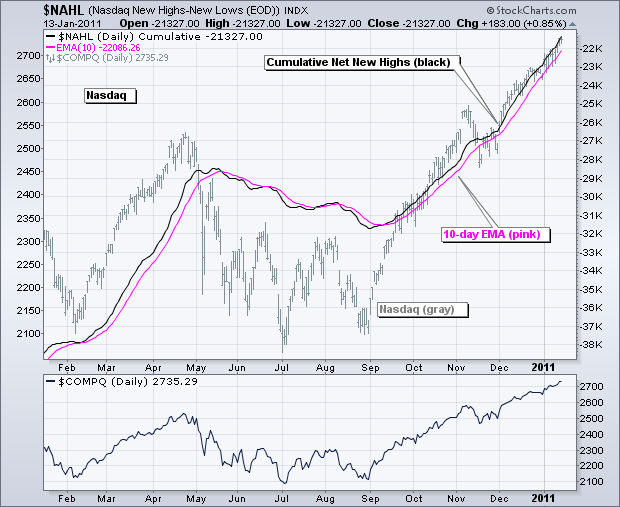
The base security for the AD Line is Advance-Decline Issues, such as Nasdaq Advance-Decline Issues ($NAAD). The base security for the AD Volume Line is Advance-Decline Volume, such as NYSE Advance-Decline Volume ($NYUD). The base security for the Cumulative Net New Highs Line is New High-New Lows, such as TSE New Highs-New Lows ($TOHL). Simply enter these symbols and choose cumulative for the chart type. The underlying index can be placed behind the cumulative indicator or in a separate window above or below. These indicators are available for the Amex ($AMAD,$AMUD,$AMHL), Nasdaq ($NAAD,$NAUD,$NAHL), NYSE ($NAAD,$NAUD,$NYHL) and TSE ($TOAD,$TOUD,$TOHL).


