|
|
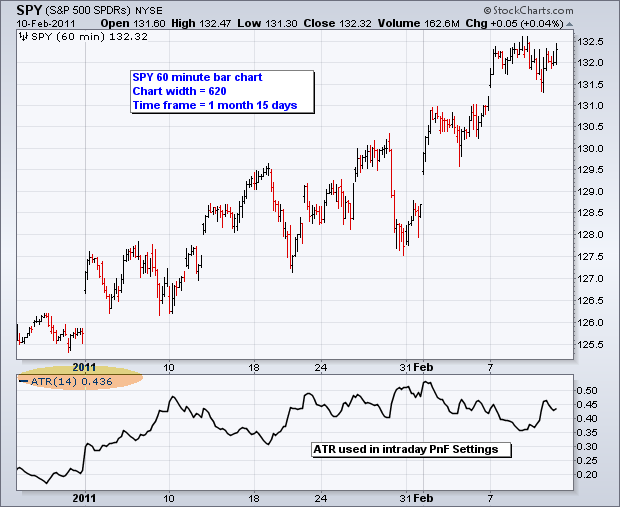
Intraday charts are normally associated with short-term analysis that extends anywhere from several days to several weeks. Even with the largest intraday timeframe, 60 minutes, bar charts get crowded with more than seven weeks of data. The chart below shows 60-minute bars for SPY going back 1 month and 15 days. This chart, size 620, is full with no room for more data, unless one chooses a wider chart size, which is possible. If only there were a way to filter out the uneventful moves with the eventful moves.

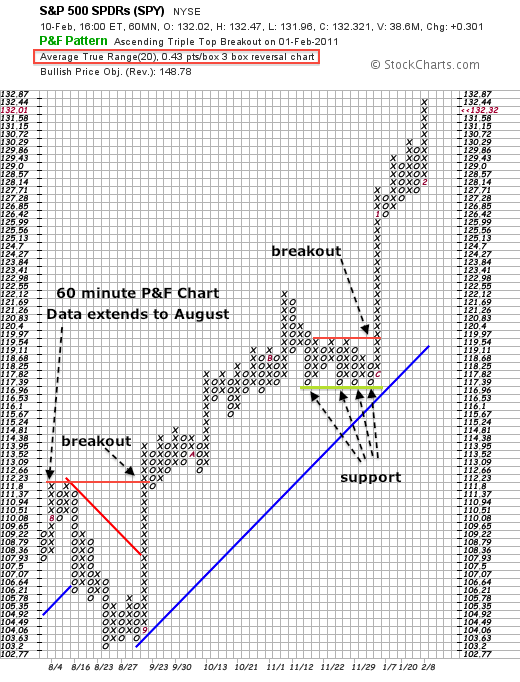
Enter the intraday P&F chart. The P&F chart below is based on 60-minute data and it extends all the way back to August. See the red “8” in the lower left. In fact, many 60-minute P&F charts extend back 3-6 months. Elapsed time depends on the number of price reversals because P&F charts extend only when prices reverse a specific amount. These 60-minute P&F charts offer both perspective and detail. In addition to the bigger trend, chartists can easily identify shorter trends, smaller patterns, support/resistance and breakouts.
Chart Note: Intraday P&F charts default to 20-period Average True Range (ATR) for the box size. This means the box size is flexible and dependent on the price range of the security. The SPX ATR setting is at .43 currently. To fix this box size, move to "user defined" for scaling method and set the box size at .43. Percentage scaling is the alternative to ATR. This sets the box size at a fix percentage, just like a log scale on a bar chart. Click here for more articles related to P&F charting.


Posted by: Keith Shepard February 11, 2011 at 10:50 AM