|
|
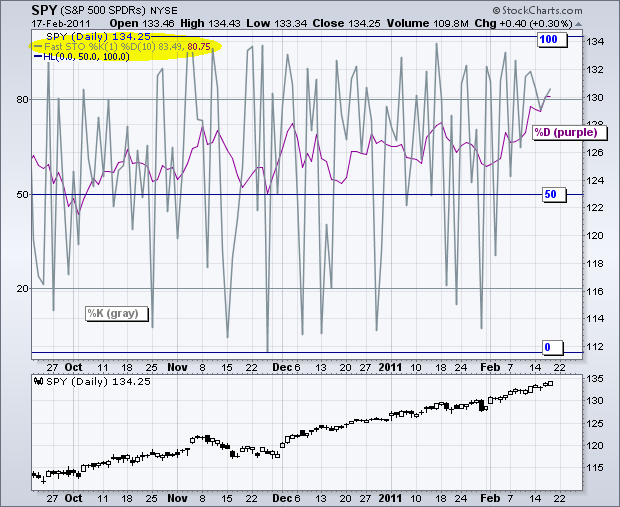
A 1-period Fast Stochastic Oscillator can be used to measure the strength or weakness of the close on a daily basis. Daily readings in this classic indicator reflect the level of the close relative to the high-low range. A close at the high equals 100 and a close at the low equals 0. Closes at the exact high or exact low are rare. We can however, assume, that readings between 80 and 100 reflect a strong close, while readings between 0 and 20 indicate a weak close. Overall, the 1-period Fast Stochastic Oscillator is above 50 when the close is above the mid point of the high-low range and below 50 when the close is below the mid point.

Click this image for a live chart
Fast Stochastics (1,10) shows this indicator with a 10-day SMA. In this example, %K is the 1-period Fast Stochastic Oscillator and %D is a 10-day moving average of %K. A moving average smooths that data and shows the general tendency. As you can see, this 10-day SMA has been above 50 since early October. Most recently, the 10-day SMA moved above 80 for the first time since late July 2009. This tells us two things. First, SPY has closed in the upper half of its high-low range more often than not since early October. Second, price action has been exceptionally strong the last 10 days as the 10-day SMA moved above 80. Don’t forget, SharpCharts subscribers can click this chart to see the settings and save it to their favorites list. SPY was made invisible in the main window and the Fast Stochastics indicator was placed in behind this invisible price.


Posted by: Frank Kothbauer February 19, 2011 at 16:26 PM