|
|
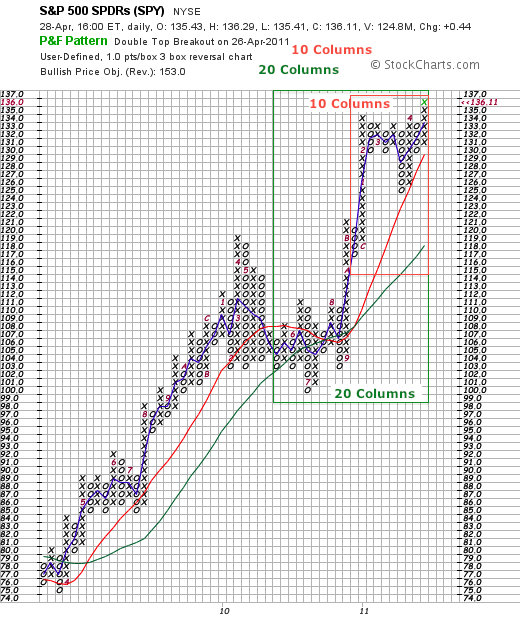
Moving averages on Point & Figure charts are based on the average price of each column. Let’s start with a 1-period SMA for an easy example. If an X-Column extends from 131 to 136, then the 1-period SMA would be 133.5 {(131 + 136)/2 = 133.5}. The chart below shows SPY with the most recent X-Column. There are six X’s extending from 131 to 136. The blue 1-day SMA is currently in the exact middle of that column (between the 3rd X and the 4th X). The red line shows a 10-period SMA and the green line shows a 20-period SMA. A 10-period SMA is the average price of the last 10 columns, which is marked by the red box. A 20-period SMA is the average price for the last 20 columns, which is marked by the green box.

Double smoothing means shorter moving averages are required. Taking the average of the column smooths price once. A moving average greater than 2-period smooths price a second time. With this double smoothing, chartists can use shorter moving averages with P&F charts. Chartists can use 10-day SMAs on P&F charts instead of 50-day SMAs on bar charts.
A 1-period moving average produces a pretty good medium-term proxy for the trend. The trend is up when the 1-period SMA moves above the 10-period SMA and down otherwise. Chartists can also look for resistance and support breaks on the 1-period SMA. Notice the little consolidation during the summer and breakouts in August-September 2011 (red 8 and 9). With a reaction low at 129, the 1-period SMA has established a support level to watch going forward.


