|
|
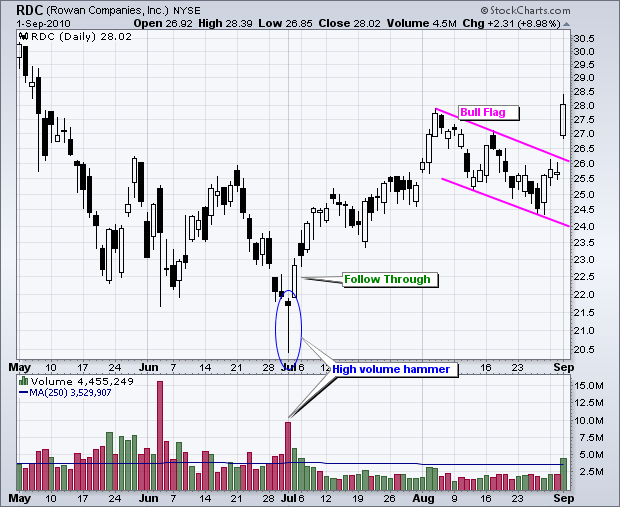
A Selling Climax is a high volume decline that is suddenly reversed. Candlesticks are especially helpful for identifying a selling climax. In particular, chartists should be on the look out for high volume Hammers, Bullish Engulfing patterns and Piercing Lines. Before looking for such patterns, remember that the security should be in a clear downtrend with the current move being down, usually sharply down. A Hammer is a signal candlestick pattern with a long lower shadow and a small body near the top of the range. This patterns shows that sellers pushed the stock sharply lower during the day, but buyers reasserted control to force a strong close. High volume reinforces this pattern. The chart below shows Rowan Companies (RDC) with a high volume hammer at the beginning of July 2010 and follow through the next day.

Click this image for a live chart
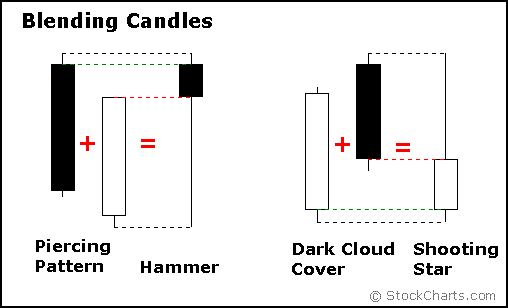
Bullish Engulfing patterns and Piercing Patterns are a lot like Hammers. In fact, blending the two candlesticks from these patterns often results in a Hammer. Two candlesticks can be merged into one by taking the open of the first and the close of the second. The highest high and the lowest low of the two are then used for the high-low range. The image below shows two examples of blending candlesticks.

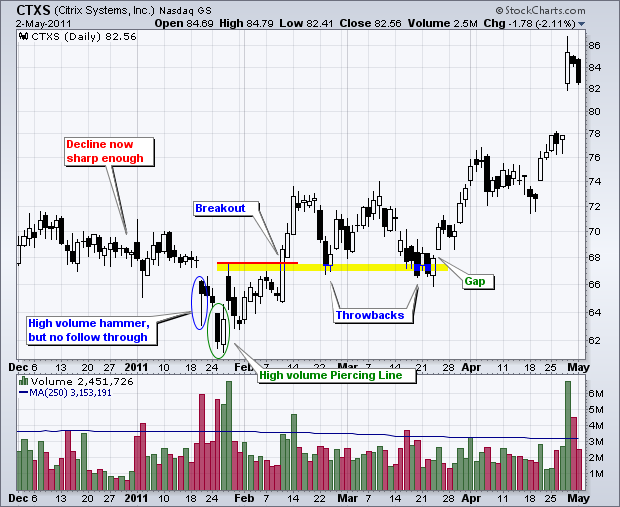
The chart below shows Citrix Systems (CTXS) with a high volume Piercing Line at the end of January 2011. Notice that volume was very high on both days, which reinforces the reversal pattern. CTXS broke resistance two weeks later.

Click this image for


