|
|
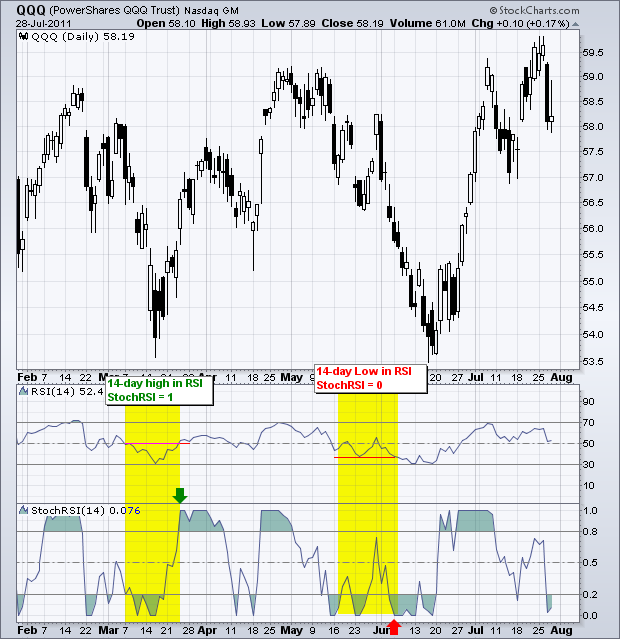
StochRSI is volatile because it is an indicator of an indicator. Most indicators are derived directly from price. StochRSI is derived directly from RSI values, which are derived from price. This means StochRSI is two steps removed from the actual price. This is also known as the second derivative. Using the Nasdaq 100 ETF (QQQ) as an example, 14-day StochRSI would be 14-day Slow Stochastics applied to 14-day RSI for QQQ.

Click this image for a live chart.
Developed by Tushard Chande and Stanley Kroll, StochRSI was designed to increase sensitivity and signals from RSI. And it does. The chart above shows RSI fluctuating between 30 and 70 the last five months. There was one brief blip above 70 in mid February. StochRSI, on the other hand, gyrates between zero and one on a regular basis. A move to 1 indicates that RSI is at a 14-day high, while a move to 0 indicates that RSI is at a 14-day low. StochRSI is used to anticipate breakouts and surges in RSI, which in turn is used to anticipate turns in QQQ. You can read more on StochRSI in our ChartSchool.


