|
|
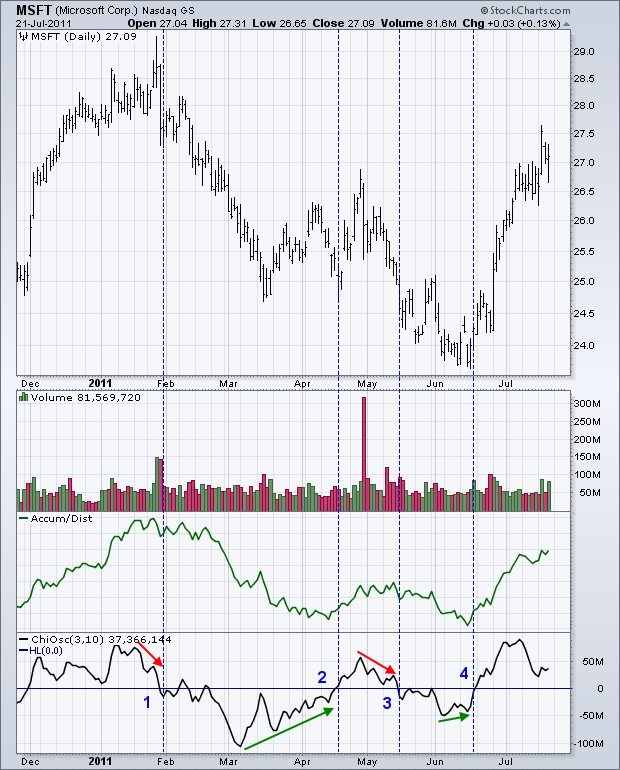
Invented by Marc Chaikin, the Chaikin Oscillator is an indicator of an indicator. In particular, it measures the momentum of the Accumulation Distribution Line, which is also a Chaikin indicator. The Chaikin Oscillator (3,10) shows the difference between the 3-day EMA of the Accumulation Distribution Line and the 10-day EMA of the Accumulation Distribution Line. The Chaikin Oscillator is positive when the 3-day EMA is above the 10-day EMA and negative when the 3-day EMA is below the 10-day EMA.

Click this image for a live chart.
The chart above shows Microsoft (MSFT) with the Chaikin Oscillator and Accumulation Distribution Line. As a momentum indicator, the Chaikin Oscillator is designed to lead the Accumulation Distribution Line, and it does. Notice how the oscillator turned down ahead of the Accumulation Distribution Line in January and moved into negative territory at the end of the month (1). The oscillator turned up in March and moved into positive territory in mid April (2). There was another downturn in late April and move into negative territory by mid May (3). And finally, the oscillator bottomed ahead of the Accumulation Distribution Line in early June and turned positive the third week of June (4). Signals 1 and 4 were quite good, while signals 2 and 3 resulted in whipsaws. You can read more about these indicators in our ChartSchool (click here).


