MailBag August 26, 2011 at 01:14 PM
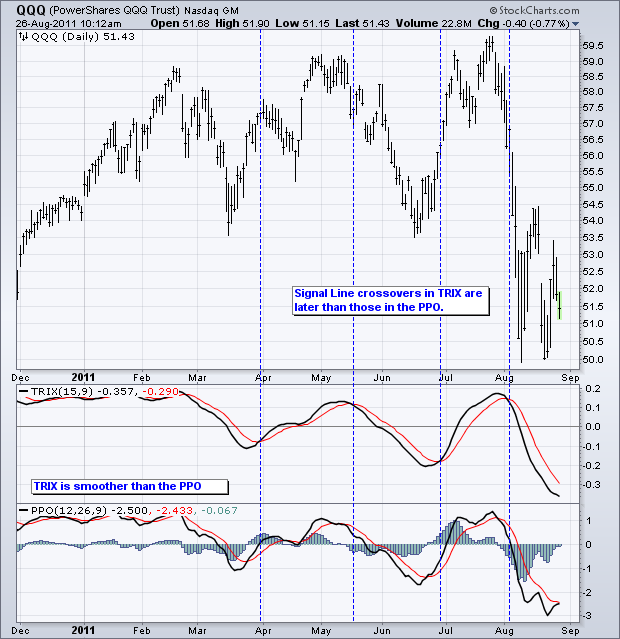
The TRIX oscillator is based on a triple smoothed exponential moving average. First, start with a regular 15-period EMA. Second, take the 15-period EMA of the regular EMA. This is the double smoothed EMA. Third, take the 15-period EMA of the double smoothed EMA. This is a triple smoothed EMA. The TRIX is based on this triple smoothed EMA. The last step is to measure the 1-period Rate-of-Change in this triple smoothed EMA. The 15-period triple smoothed EMA is moving higher when the 1-period ROC (15-period TRIX) is positive. Conversely, the 15-period triple smoothed EMA is moving lower when Read More
MailBag August 12, 2011 at 06:13 PM
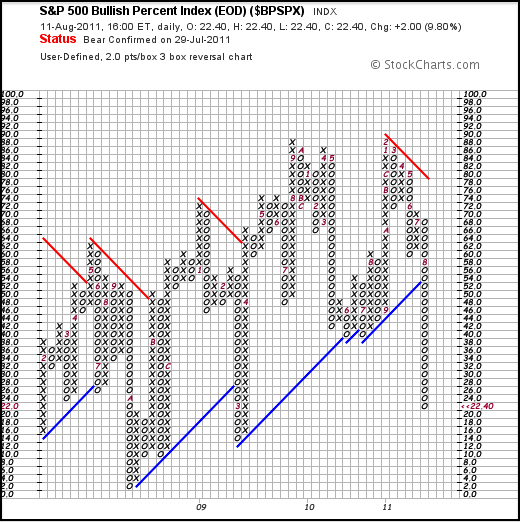
Before looking at the interpretation, lets review what the Bullish Percent Index actually is. The BPI tells us the percentage of stocks on a P&F buy signal. BPIs are based on various indices and sectors. A stock within this index or sector is on a P&F buy signal or P&F sell signal. A basic P&F buying signal is a Double Top Breakout. A basic P&F sell signal is a Double Bottom Breakdown. The Bullish Percent Index oscillates between zero and one hundred. There are three signals or levels to watch. First, the bulls have the edge when more than 50% of the index components Read More
MailBag August 05, 2011 at 09:42 AM
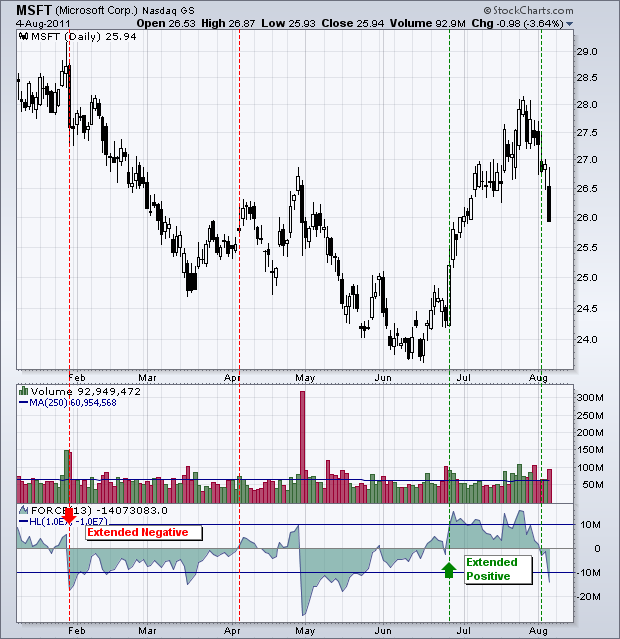
The Force Index is a price-volume oscillator designed to measure the balance of power behind a particular move. The Force Index rises when the close is above the prior close and falls when the close is lower. This rise or fall is enhanced by the extent of the move and the volume behind it. A strong advance on big volume pushes the Force Index sharply higher, while a sharp decline on big volume pushes it lower. The Force Index oscillates above/below the zero line. At its most basic, readings above zero generally favor an uptrend, while readings below zero favor a downtrend. As the Read More