MailBag

What exactly is the TRIX oscillator?

 | 

The TRIX oscillator is based on a triple smoothed exponential moving average. First, start with a regular 15-period EMA. Second, take the 15-period EMA of the regular EMA. This is the double smoothed EMA. Third, take the 15-period EMA of the double smoothed EMA. This is a triple smoothed EMA. The TRIX is based on this triple smoothed EMA. The last step is to measure the 1-period Rate-of-Change in this triple smoothed EMA. The 15-period triple smoothed EMA is moving higher when the 1-period ROC (15-period TRIX) is positive. Conversely, the 15-period triple smoothed EMA is moving lower when the 1-period ROC (15-period TRIX). In short, the TRIX tells us the direction of this triple smoothed EMA.
110828mailqqq
Click this image for a live chart.

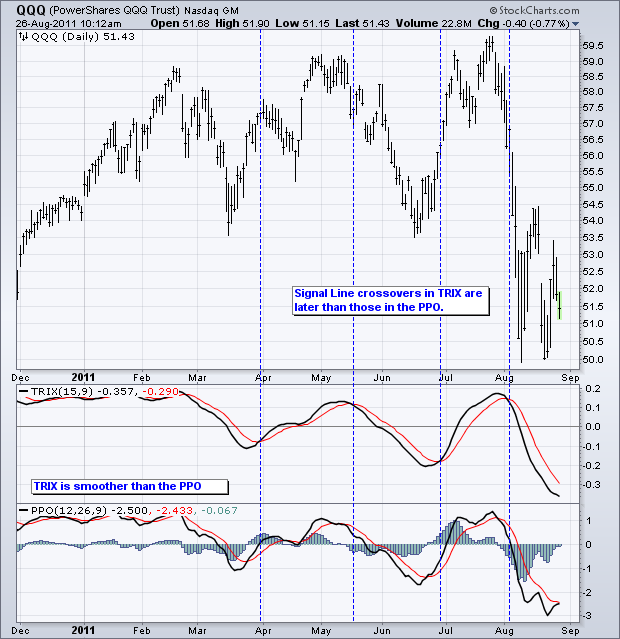
Movements in the TRIX are quite similar to those in MACD or the Percent Price Oscillator (PPO), only smoother. This, of course, comes from the triple smoothing of the EMA. The chart above shows QQQ with TRIX (15,9) and the PPO (12,26,9). Notice that both use a 9-period EMA as a signal line. The TRIX is a lot smoother and produces fewer signal line crossovers. Smoothness comes at a price though. These signals are also a few days later than the MACD signal line crossovers. The difference between these two oscillators highlights the eternal conundrum for technical analysis. Faster oscillators produce quicker signals, but generate more whipsaws. Slower oscillators produce fewer whipsaws, but have more lag. Finding the golden middle is the challenge.

Arthur Hill
About the author: , CMT, is a Senior Technical Analyst at StockCharts.com. He has written articles for numerous financial publications including Barrons and Stocks & Commodities magazine. Focusing predominantly on US equities and ETFs, his systematic approach of identifying trend, finding signals within the trend, and setting key price levels has made him an esteemed technician. In addition to his CMT designation, Arthur holds an MBA from the Cass Business School at City University in London. Learn More
Subscribe to MailBag to be notified whenever a new post is added to this blog!
Thanks for the great post concerning TRIX. This was the first time I had learned much about it, and this was an excellent overview. It looks like an interesting alternative to MACD or PPO. I have two thoughts: First, you point out that in this example, the TRIX (15, 9) gives slower signals than the PPO (12, 26, 9). While that's true, I think that's more of an artifact of the periodicity settings that you're using. I massaged the inputs for TRIX, and found that a TRIX (9, 7) setting seems to give very similar results to PPO (12, 26, 9) or MACD (12, 26, 9). In that case, the crossovers of the signal line are virtually the same, although the TRIX remains smoother. Second, since TRIX is fundamentally similar to MACD and PPO, is there a reason that StockCharts doesn't support a divergence (histogram) value for TRIX, similar to the historgram for MACD and PPO? This would seem to be a useful measurement. Unfortunately, it's not currently available through StockCharts, as shown above.
comments powered by Disqus