|
|
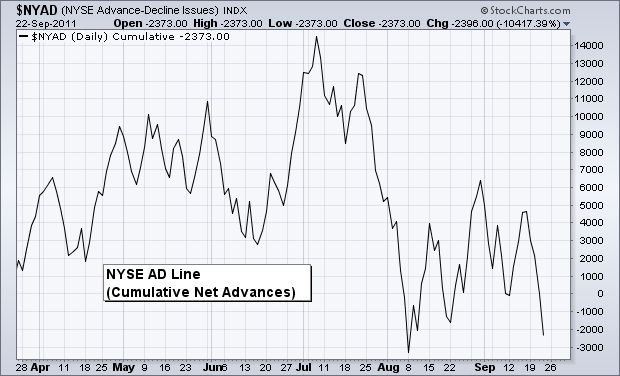
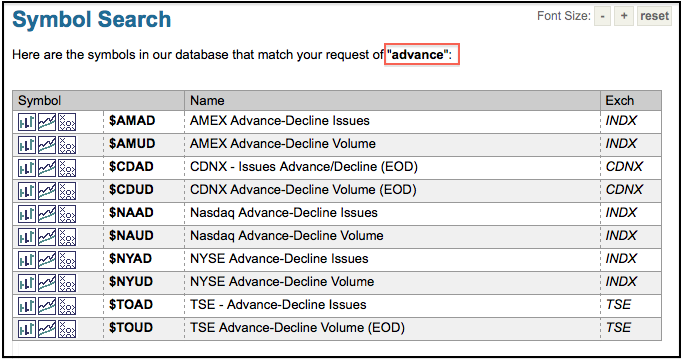
The AD Line starts with Net Advances, which is advancing issues less declining issues. Stockcharts.com provides Net Advances data for the AMEX, CDNX, Nasdaq, NYSE and TSE. The symbols are shown at the end of this commentary. First, enter the symbol for Net Advances. In this example, we are using the NYSE Advance-Decline Issues ($NYAD). A line chart, bar chart or candlestick chart will show one big choppy data series that fluctuates between positive and negative territory.

Click this image for a live chart.
To give this data some direction, chartists edit the settings by going to “Chart Attributes” and then “Type”. Click the drop down box arrow and select “Cumulative”. Click update and the choppy data turns into a line chart that can be used analyze this breadth indicator. Chartists can apply this technique to Net Advances (Advance-Decline Issues), Net Advancing Volume (Advancing Volume-Declining Volume) and Net New Highs (New Highs – New Lows).


