|
|
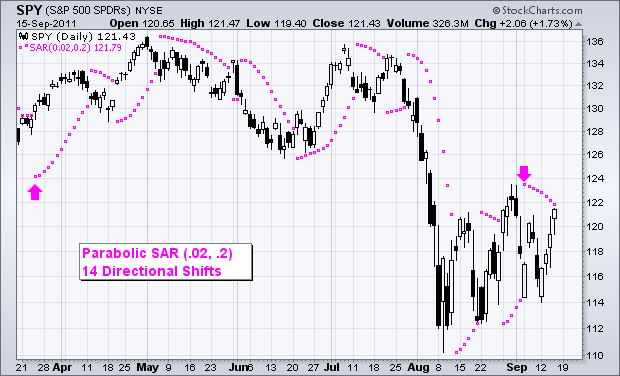
Developed by Wells Wilder, Parabolic SAR stands for Parabolic Stop and Reverse (SAR). It is a popular indicator for setting stops and identifying directional shifts in price. The default setting (.02, .2), however, can produce quite a few directional changes and trigger lots of stops.

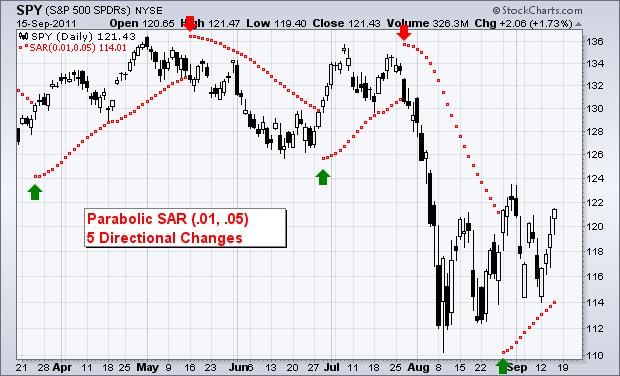
Chartists can reduce these directional shifts by decreasing the parameters. The first parameter (.02) is called the step. The second parameter (.2) is the maximum step. Reducing the step to .01 and the maximum step to .05 reduces the number of directional changes to four. This allows for bigger moves before the indicator triggers a stop or signals a directional change. This example uses SPY. Different settings may be required for different, and more volatile securities. You can read more on the Parabolic SAR in our ChartSchool.

Click this image for a live chart.


