|
|
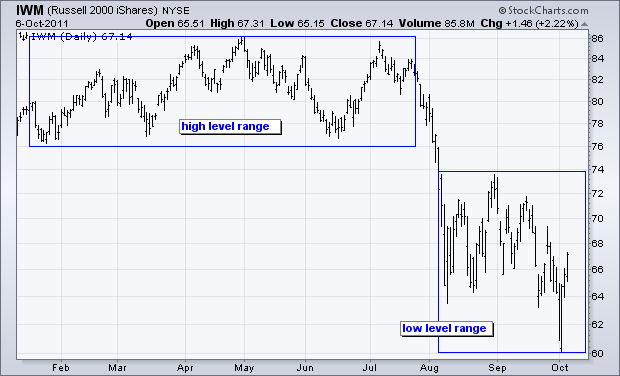
The 3 to 5 day swings in the stock market have been quite wild since early August. The Russell 2000 ETF (IWM) boasts 11 swings of 5% or more since the second week of August. That is 11 swings in eight weeks or one swing every 4 days. It is enough to make a trader seasick. Chartists with a longer focus can filter out these moves by using moving averages or even a long-term Stochastic Oscillator. The first chart shows IWM trading within a high level range early in the year and a low level range the last two months. The one big decline in between sets the long-term tone. The current trading range is very volatile, which can hinder interpretation.

Click this image to see the current chart.
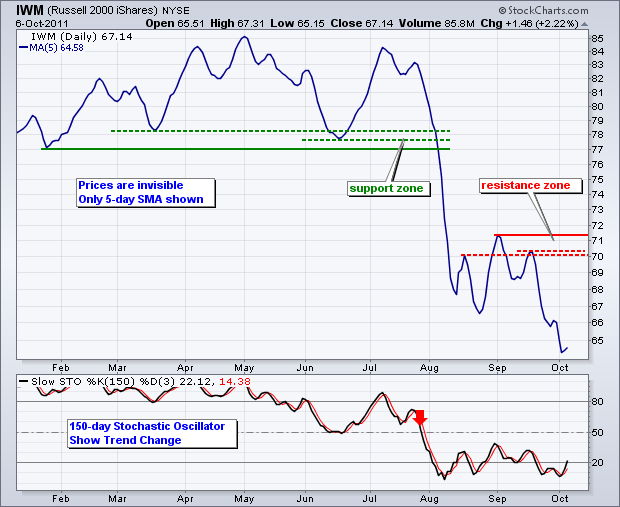
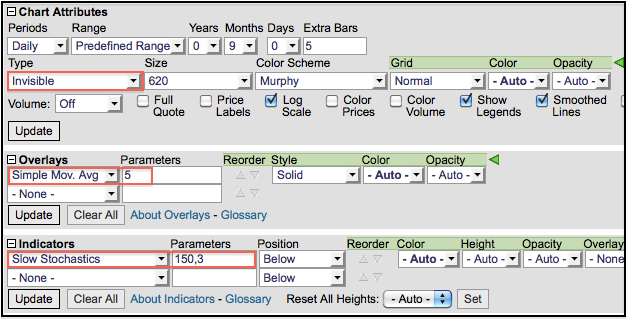
Chartists can make daily price action invisible and simply analyze a short moving average. The chart below shows the 5-day SMA for IWM. The price bars were hidden by choosing “invisible” for Chart Type. Chartists can apply normal analysis techniques to this moving average. For example, IWM broke a clear support zone in early August and there is now a resistance zone in the 70-71 area. The indicator window shows the 150-day Stochastic Oscillator. This indicator was above 50 during the first half of the year, which is when the bulls had the edge. The oscillator broke down in late July and the bears have the edge as long as this indicator remains below 50. The cup is half full above 50 and half empty below 50.

Click this image to see the current chart.


