|
|
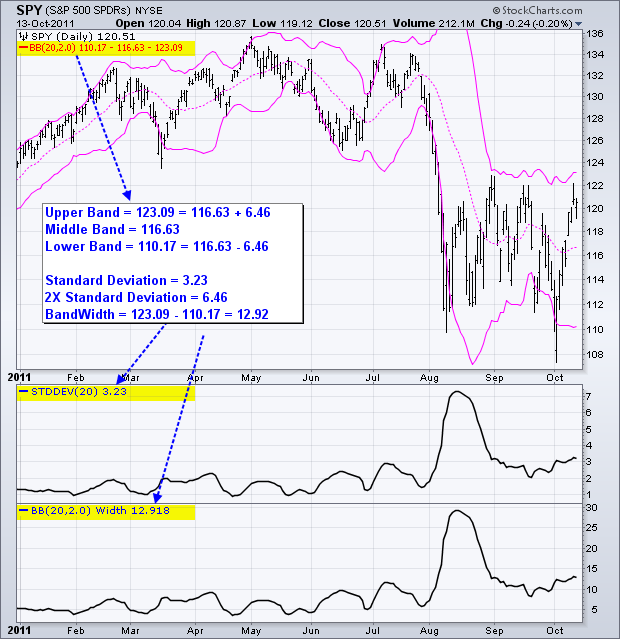
The short answer is with the Bollinger Band Width indicator in SharpCharts. Now for the long answer. Created by John Bollinger, Bollinger Bands are volatility bands with a moving average in the middle. The default setting is 20-periods and 2 standard deviations. This means the moving average, middle line, is a 20-period simple moving average. The upper and lower bands are then set 2 standard deviations from this moving average. 20-periods is also used for the standard deviation, which is a measure of volatility. By using the standard deviation to set Band Width, Bollinger Bands are dynamic indicators that change as volatility changes.
Click this image to see the current chart.
The example above shows the S&P 500 ETF (SPY) with Bollinger Bands (20,2). The standard deviation is shown in the first indicator window and Bollinger Band Width is in the second window. As you can see from the line shapes, Bollinger Band Width is derived from the standard deviation. In fact, Bollinger Band With is simply four times the standard deviation (3.23 x 4 = 12.92). Chartists can use the Bollinger Band Width indicator and the standard deviation to identify periods of relatively low volatility and periods of relatively high volatility. You can read more on John Bollinger's indicators in our ChartSchool.


