|
|
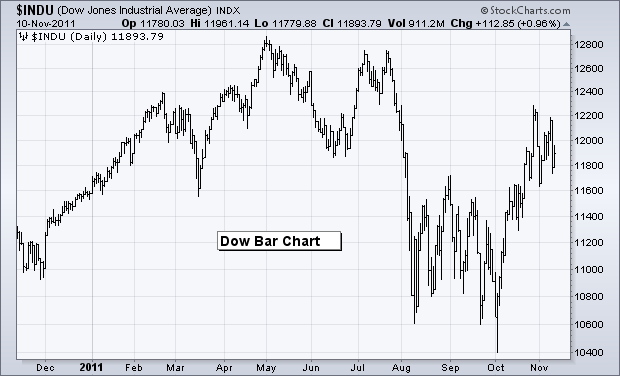
Volatility is picking up once again as the Dow produced at least three swings greater than 350 points in the last three weeks. The Dow surged from 11700 to 12231 in three days at the end of October. The senior Average then fell back below 11700 the two days ending November 1st and surged back above 12150 early this week. Not to be outdone, the Dow then plunged below 11800 with a sharp decline this past Wednesday. While volatility is not at the August-September levels, it is certainly heating up again.
Click this image for a live chart.
While we cannot eliminate volatility, chartists can use price-filtering charting styles to reduce its impact on the chart. StockCharts.com offers Kagi, Renko and P&F charts. The example below shows the Dow Industrials using Renko charts. Each box is 150 points, which means moves less than 150 points are ignored. The white boxes represent advances, while the black boxes represent declines. It takes a 300 point move to reverse direction. In other words a white box followed by a black box signals a 300 point price swing, just as a black box followed by a white box. Currently, the Renko chart marks a key support level at 11700.
Click this image for a live chart.


