|
|
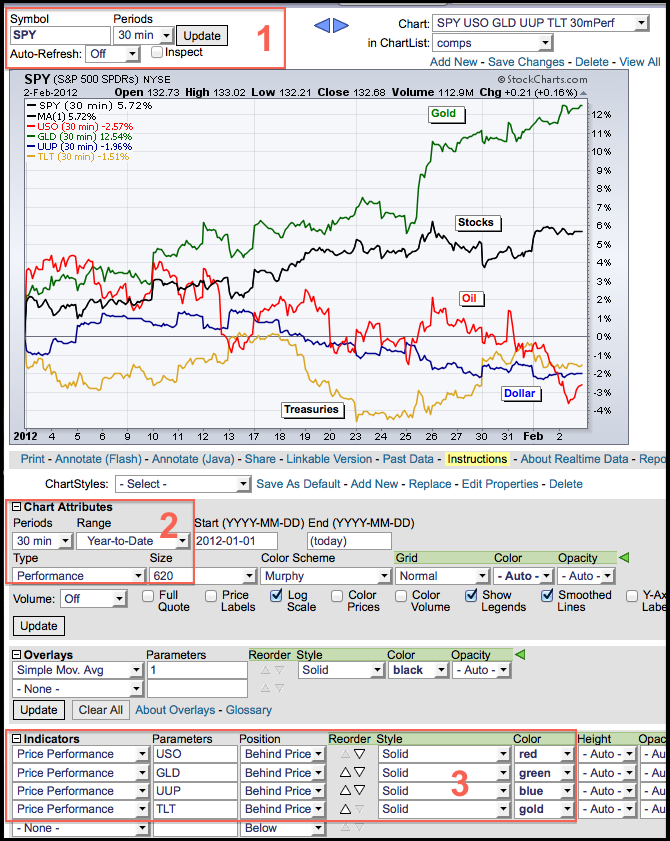
Performance charts can be created with SharpCharts using “Performance” as the chart type and “Price Performance” as an indicator. For the first steps, enter a symbol, select the periods and then choose “Performance” under chart attributes/type. In the example below, I entered SPY and it will show in the main window. Second, go to “Chart Attributes” and choose the intraday period of choice, the date “Range” and the “Type”. In this example, I choose a 30 minute line chart that shows the year-to-date performance, which is the percentage change since December 31st.
Click this image for a live chart.
The remaining securities can be entered as indicators by choosing “Price Performance” and positioning them “Behind Price”, which is behind the SPY plot. I changed the “Style” to solid and the “Color” to differentiate the lines for each plot. Notice that the Gold SPDR (GLD) is the top performer year-to-date. Stocks are also doing well as SPY is up over 5% year-to-date. The rest of the intermarket ETFs are down for the year.


Posted by: Jan Kuehl February 03, 2012 at 21:15 PM