|
|
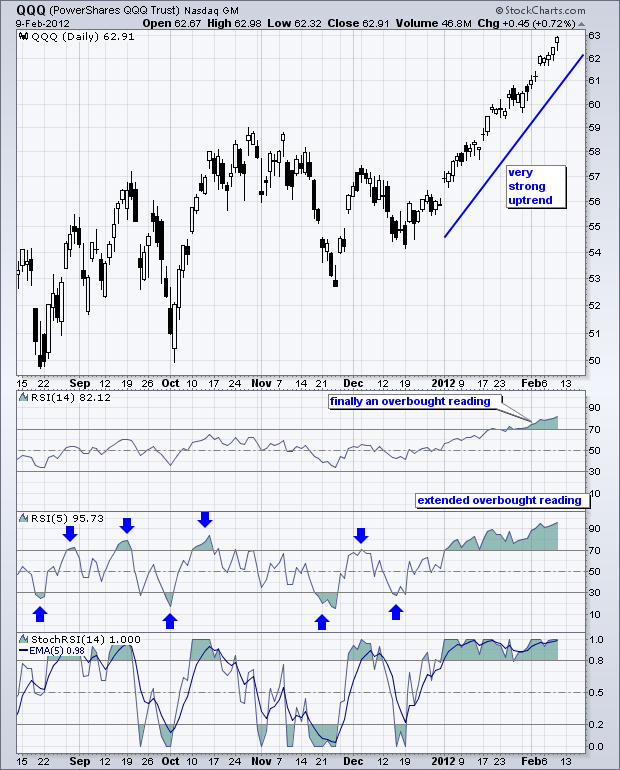
Momentum oscillators can be used to identify overbought and oversold conditions in stocks and other securities. However, some momentum oscillators do not reach extremes during strong trends. For example, RSI is a great momentum oscillator, but it does not always reach overbought or oversold levels when used with the default settings (14 periods). Chartists can increase the sensitivity by decreasing the number of periods. 5-period RSI, for example, will reach overbought and oversold levels more often than a 14-period RSI.
Click this image for a live chart.
The chart above shows the Nasdaq 100 ETF (QQQ) with RSI(14) never reaching overbought or oversold levels until the second half of January. In contrast, the middle indicator window shows RSI(5) reaching overbought and oversold levels numerous times. Once oversold, a move back above 30 signals an upturn in momentum. Once overbought, a move back below 70 signals a downturn in momentum. After the October surge and breakout, RSI(14) did not become oversold and did not identify corrections. RSI(5), on the other hand, identified two corrections with dips below 30 in November and December. An even shorter timeframe, such a 2 period RSI, would produce even more overbought and oversold readings. Chartists can also use StochRSI(14) to identify corrective periods. This is the Stochastic Oscillator applied to RSI. You can read more about RSI and StochRSI in our ChartSchool.


