|
|
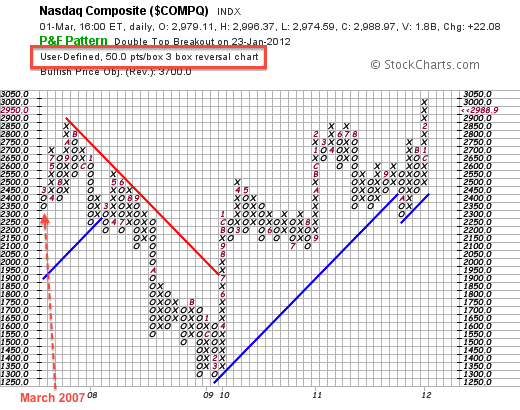
Because Point & Figure charts are based on price movements and do not take time into consideration, chartist must change the box size or reversal amount to adjust the lookback period. X-Columns reflect rising prices, while O-Columns reflect falling prices. Each box represents a specific value and the columns reversal when there is directional price change of at least three boxes. The higher the box value, the bigger the price movement required for a column extension or reversal. The chart below shows the Nasdaq Point & Figure chart based on 50-point boxes and a 3-box reversal. Notice that this chart extends back to March 2007, which is marked by the red “3” on the far left of the chart.
Click this image for a live chart.
Chartists wishing for an even longer look-back period need to increase the box size. The chart below shows the Nasdaq P&F chart with 100 point boxes. Notice that this chart extends back to February 2000 and offers a much bigger picture. Users can change the box size by selecting “user defined” and entering their desired box size. Changing the reversal amount can also extend the look-back period. A 4-box reversal P&F chart would have a longer look-back period than a 3-box reversal chart.
Click this image for a live chart.


