|
|
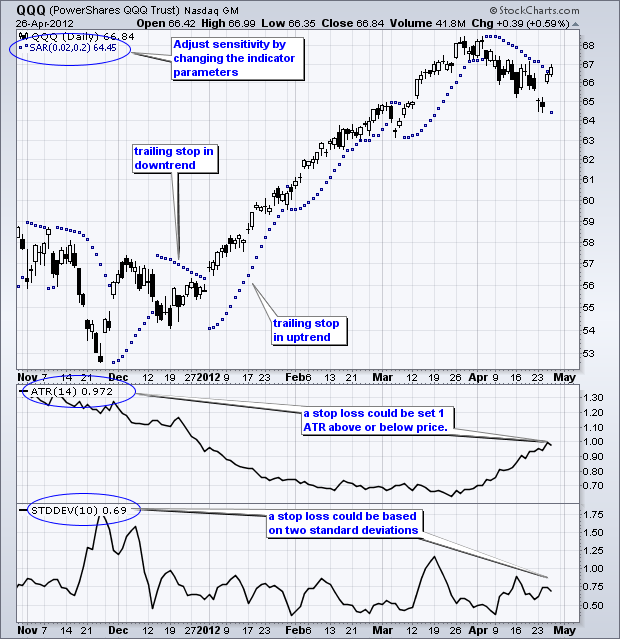
SharpCharts has several indicators that can be use to set stops. Wells Wilder, creator of RSI and the Average Directional Index (ADX), developed two indicators that can be used to set stops: the Parabolic SAR and Average True Range (ATR). Parabolic SAR is a stop-and-reverse system that adjusts as prices change direction. It is below prices in an uptrend and above prices in a downtrend. More importantly, it trails prices as the trend unfolds. This means it can be used to consistently raise stops as an uptrend extends and lower stops as a downtrend extends.
Click here for a live chart.
The next two indicators measure price volatility, which means they can be used to calculate a volatility-based stop. The Average True Range (ATR) uses the previous close, current open and high-low range to calculate volatility. The Standard Deviation is used in statistics to measure the degree of variability in a data series (closing prices in this case). Chartists can use the absolute values to set stops or a multiple of these values. For example, a stop-loss could be set 2 standard deviations below current prices. As with all indicators, users should experiment with different parameters to find those that best suit their trading preferences and the characteristics of the underlying security.


