|
|
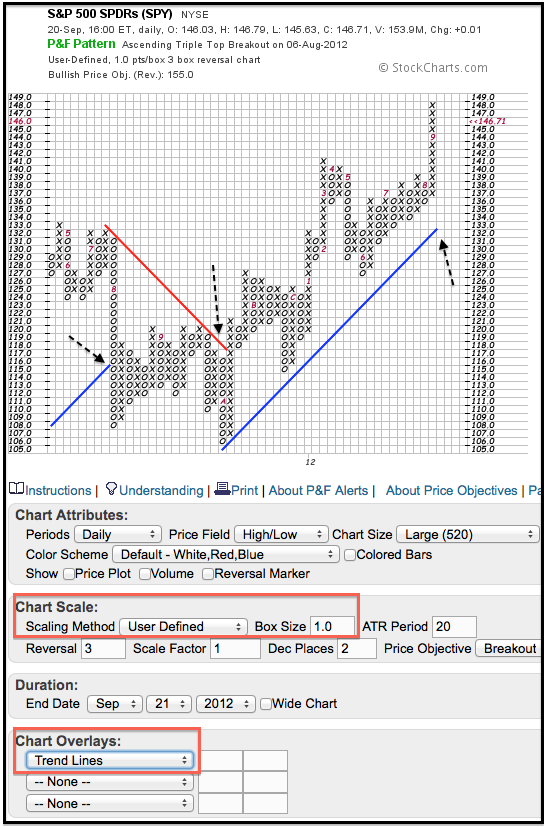
Trend lines are drawn at 45-degree angles on P&F charts. A rising trend line is called a Bullish Support Line, while a falling trend line is called a Bearish Resistance Line. StockCharts.com users can add trend lines automatically by selecting them as a chart overlay. Chartists can also add Bollinger Bands, moving averages and price-by-volume.

Click this image for a live chart.
The chart above shows the S&P 500 ETF (SPY) with user-defined boxes (1-point per box). Working from left to right, the ETF broke the Bullish Support Line (blue) with a long O-Column in August 2011. Once broken, a 45-degree Bearish Resistance Line (red) was drawn extending down from the high before the break. This line remains valid until broken, which was until October 2011. Once broken, a 45-degree Bullish Support Line was drawn from the prior low. This line currently marks support at 133. You can read more on P&F charts in our ChartSchool articles.


