|
|
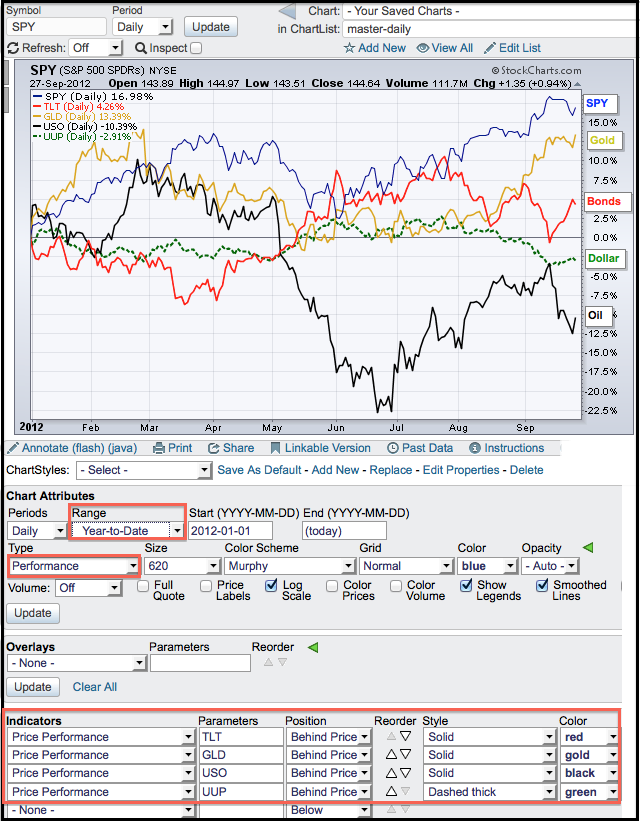
Chartists can measure price performance on a SharpChart by choosing “performance” as the chart type or “price performance” as an indicator. The chart below shows the year-to-date performance for the S&P 500 ETF, the 20+ Year T-Bond ETF, the Gold SPDR, the US Oil Fund and the US Dollar Fund. The “year-to-date” option can be found in the drop down list for the “range”. Chartists can also change the colors and line styles for easy differentiation. The image below highlights the place to make these adjustments and create a similar chart.

Click this image for a live chart.

Click this image for a live chart.


