|
|
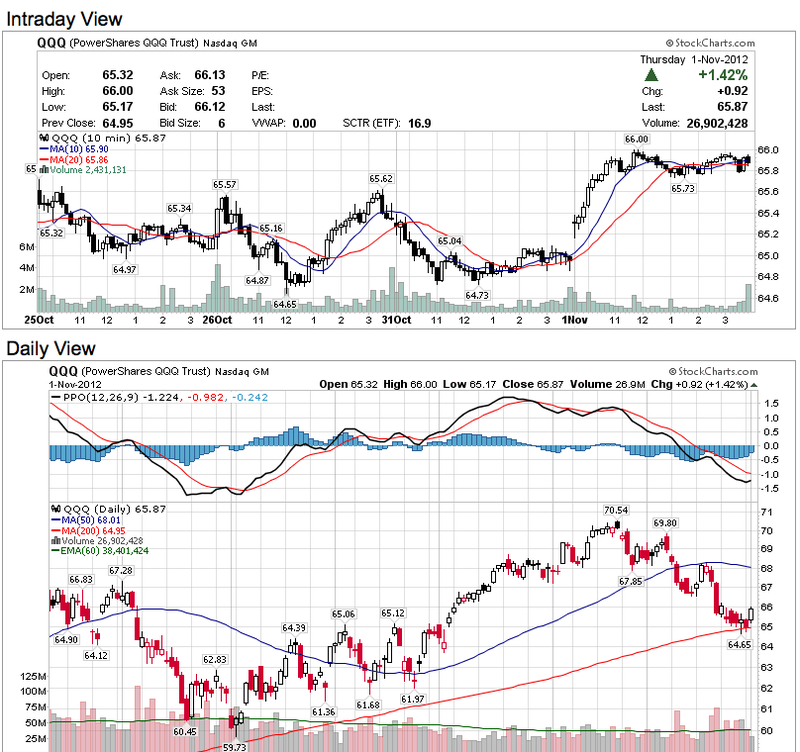
Chartists can get an instant look at different timeframes by using our Gallery View feature. Using the “create a chart” section at the top of every web page, simply select “Gallery View”, enter a symbol and press go. This will create four charts covering different timeframes for a comprehensive picture.
The first is a 10-minute chart focusing on short-term price action. The second chart shows daily candlesticks to capture the medium-term trend. A third chart shows weekly candlesticks going back 30 months for a long-term view. And finally, there is a Point & Figure chart to provide a different perspective using those classic X’s and O’s.


