|
|
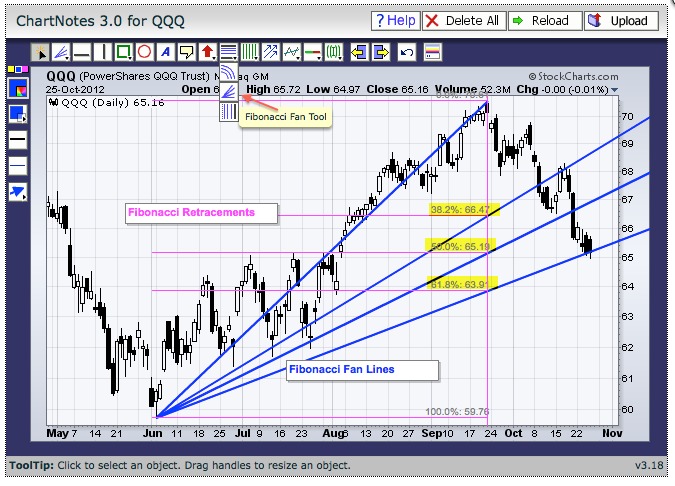
The Fibonacci Fan Tool can be used when annotating a SharpChart. Three Fibonacci tools can be found in the middle of the icon row at the top. The first vertical icon (horizontal lines) is the Fibonacci Retracements Tool. The second icon (trend lines) is the Fibonacci Fan Tool. The third icon (vertical lines) is the Fibonacci Time Zones Tool. Click the preferred icon and add it to the chart by moving the mouse to the starting point, click-hold the left button, drag to the end point and release.

The chart above shows the Fibonacci Fan Lines in blue. These are like dynamic trend lines based on Fibonacci retracements. The pink lines mark the Fibonacci retracements based on the June low and September high. The Fibonacci Fan Lines start from the June low (point A) and cross at each Fibonacci retracement (point B). These lines extend upwards from the Fibonacci retracements to mark potential support. Notice that QQQ is currently at the 61.8% fan line in the 65 area. You can read more on Fibonacci Fan Lines in our ChartSchool article.

The chart above shows the Fibonacci Fan Lines in blue. These are like dynamic trend lines based on Fibonacci retracements. The pink lines mark the Fibonacci retracements based on the June low and September high. The Fibonacci Fan Lines start from the June low (point A) and cross at each Fibonacci retracement (point B). These lines extend upwards from the Fibonacci retracements to mark potential support. Notice that QQQ is currently at the 61.8% fan line in the 65 area. You can read more on Fibonacci Fan Lines in our ChartSchool article.


