|
|
Chartists can add an indicator to an indicator using the “advanced options”, which are just to the right of the selected indicator. Adding a moving average to a momentum oscillator can help chartists identify upturns and downturns. Adding a moving average to the Accumulation Distribution Line can help chartist identify trend changes in this volume-based indicator.


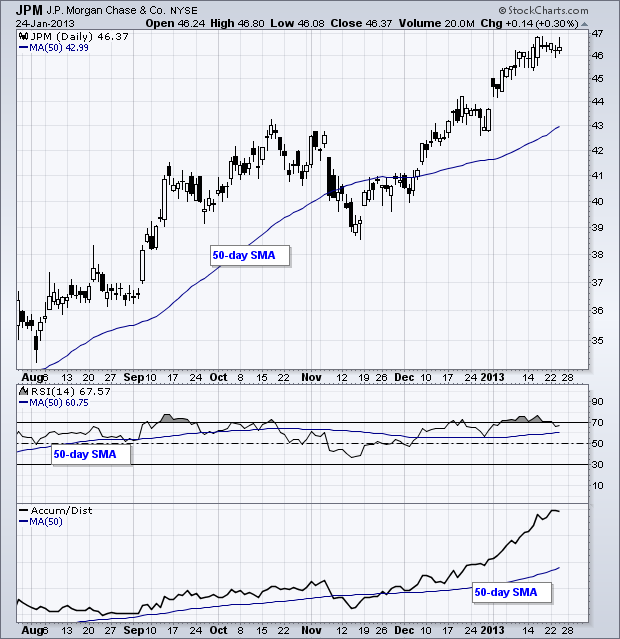
The example below shows two indicators with moving averages. First, a 50-period simple moving average was added to RSI. RSI is clearly moving higher when above its 50-day SMA and momentum is considered bullish. A break below the 50-day SMA signals a shift in momentum. Second, a 50-day SMA was applied to the Accumulation Distribution Line. Chartists can now compare how the stock reacts to its 50-day and how the indicator reacts to the same moving average. You can read more on indicators in our ChartSchool.


The example below shows two indicators with moving averages. First, a 50-period simple moving average was added to RSI. RSI is clearly moving higher when above its 50-day SMA and momentum is considered bullish. A break below the 50-day SMA signals a shift in momentum. Second, a 50-day SMA was applied to the Accumulation Distribution Line. Chartists can now compare how the stock reacts to its 50-day and how the indicator reacts to the same moving average. You can read more on indicators in our ChartSchool.


