|
|
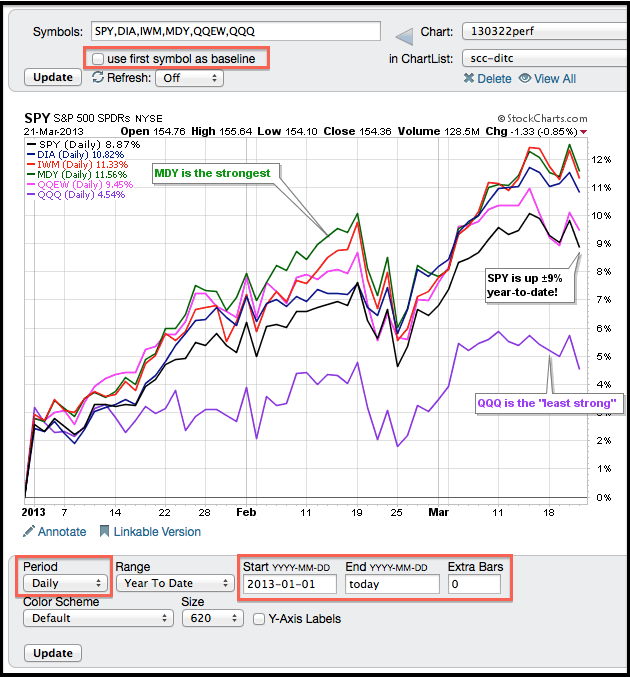
Chartists can create a performance chart using the “create a chart” box at the top of every web page. Simply enter up to six symbols separated by a comma in the symbol entry box. Leave the selection on SharpChart and click go. This will create a SharpChart showing the performance for these six symbols. The example below shows the performance for six major index ETFs since January 1st (year-to-date).

Click this image for a live chart
In addition to annotating this chart, the red boxes highlight three unique features. First, chartists can check the box to make the first symbol the baseline. In this example, SPY would become the baseline and performance would be measured against SPY. Second, the period setting can be changed. In addition to daily data, users can see intraday, weekly or monthly performance metrics. Third, user can set the start and end dates to completely customize this chart.


