|
|
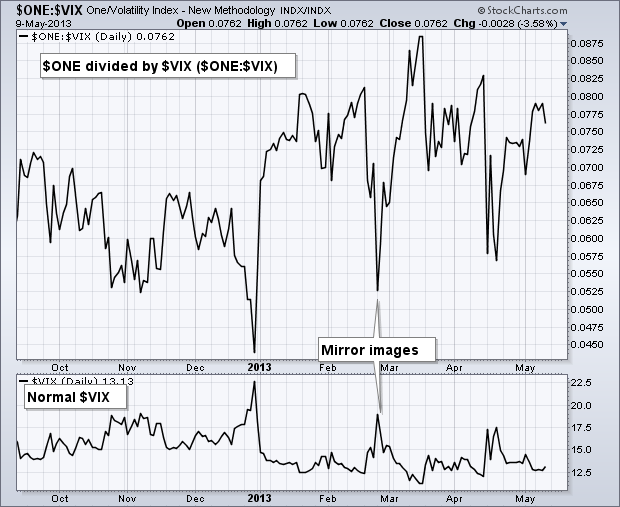
StockCharts.com users can invert a price series by using the symbol “$ONE”. Simply create a ratio chart using $ONE as the numerator and the other symbol as the denominator. The chart below shows $ONE:$VIX in the main window and the normal $VIX in the lower window. Inverted $VIX can be handy because the normal $VIX is inversely correlated with the stock market. In other words, $VIX moves up when the stock market moves down. This relation changes to a positive correlation when using inverted $VIX ($ONE:$VIX).

Click this image for a live chart

Click this image for a live chart


Posted by: Terry Flynn May 10, 2013 at 17:14 PM