|
|
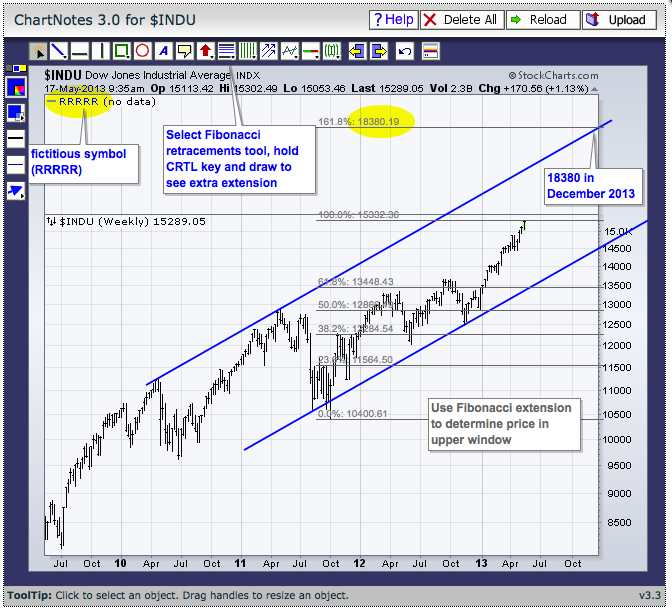
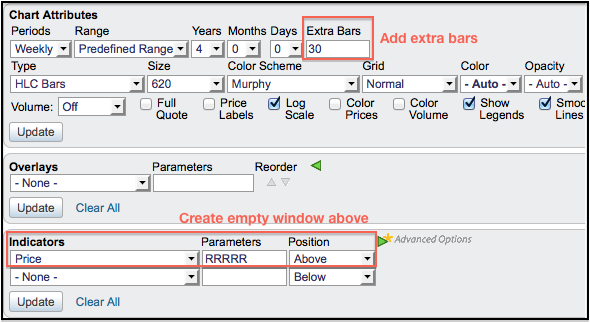
Chartists can add empty space above the main chart window by adding a fictitious “price” indicator. Chartists can also add space to the right using the “extra bars” feature. By adding space to the right and above, chartists can extend channel trendlines, add Fibonacci extensions and extend cycles to make projections. The chart below shows the Dow Industrials with added space. Notice how I used the Fibonacci Retracements Tool to add an upper extension to determine the price at a point on the channel trend line. To do this, first select the Fibonacci Retracements Tool when annotating the SharpChart. Hold the CTLR key down when drawing and the extensions will appear. The upper trend line extends to 18380 in December 2013. This is NOT a prediction! Just an example. The second image shows the settings needed to create this chart.


Click these images for a live chart


Click these images for a live chart


