|
|
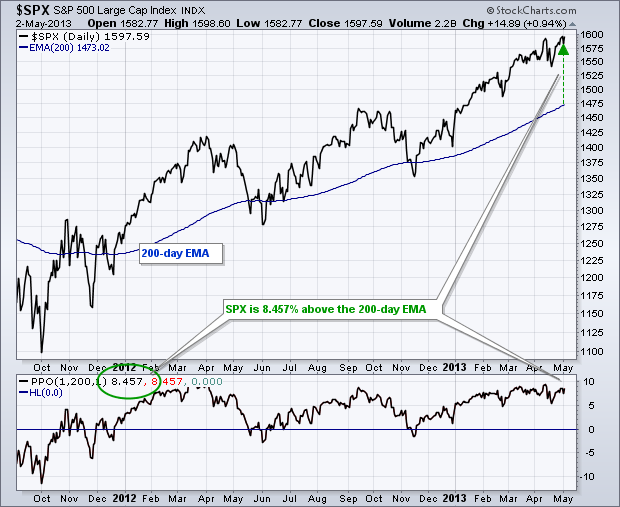
Chartists can use the Percent Price Oscillator (PPO) to measure the percentage difference between price and an exponential moving average. The PPO is measures the percentage difference between two exponential moving averages. We can set the shorter EMA equal to one and this will reflect the closing price. We can then set the longer EMA to measure the distance from price (shorter EMA). The example below shows the PPO(1,200,1), which measures the percentage difference between the S&P 500 (1-period EMA) and its 200-day EMA. I set the signal line at one to hide it on this chart. The S&P 500 is currently 8.457% above its 200-day EMA.

Click this image for a live chart.

Click this image for a live chart.


