|
|
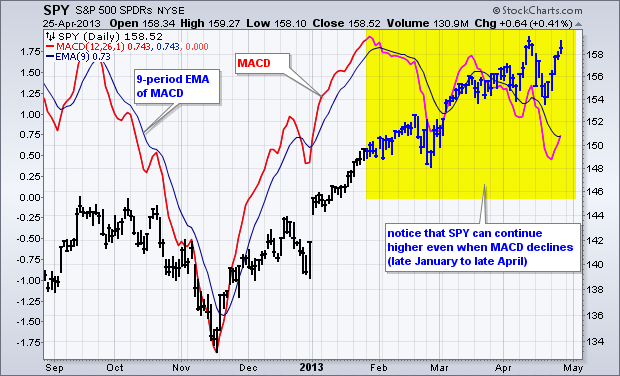
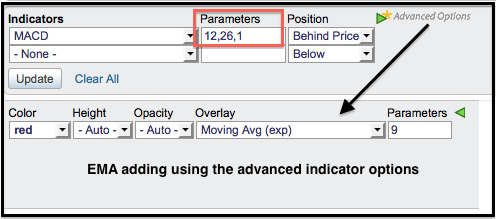
SharpCharts users can place indicators above the main window, below the main window or as an overlay in the main window. These choices are available using the drop down menu for “position”. Positioning MACD “behind price” makes it easy to compare indicator movement with price movement. The chart below shows the S&P 500 ETF (SPY) with MACD positioned behind the price plot. Note that I removed the histogram and signal line by changing the parameters to (12,26,1). The last number (1) makes the signal line a 1-day EMA of MACD, which essentially hides it. The signal line was re-added by using the advanced options to add a 9-period EMA to MACD. Nifty huh!


