|
|
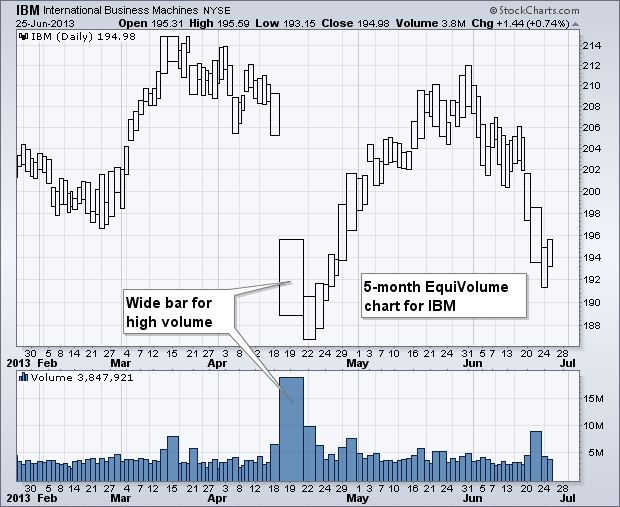
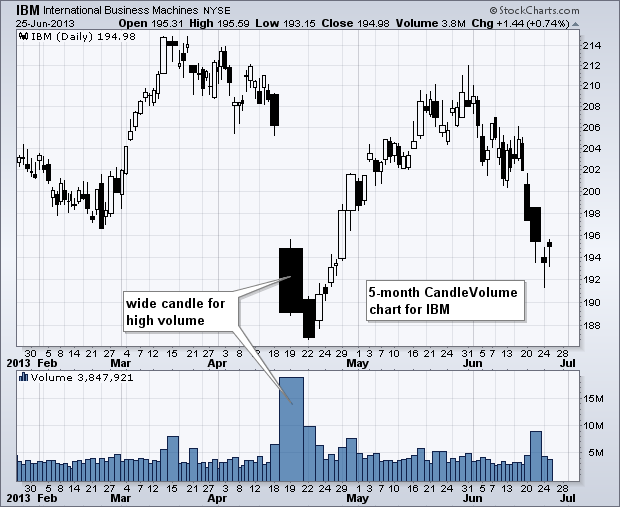
CandleVolume and EquiVolume charts merge volume and price. This gives chartists the power to measure volume while looking at the price chart. A second look at volume bars or a volume indicator is not necessary. CandleVolume charts use candlesticks that incorporate the open, high, low and close. EquiVolume charts use bars that incorporate only the high and low. The width of the candlestick or bar reflects relative volume. While both have their merits, it is clear that CandleVolume charts offer more information, namely the open and close for the period. This is pretty important information that sets CandleVolume charts apart from EquiVolume charts. You can read more on
CandleVolume and
EquiVolume in our ChartSchool.


Click this image for a live chart


Click this image for a live chart


