|
|
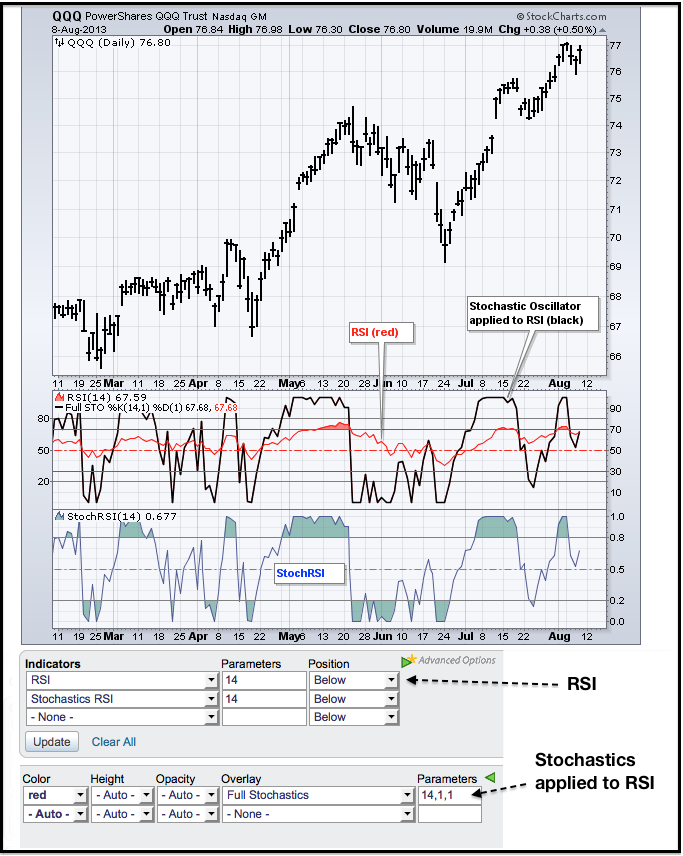
Traders can speed up to RSI by using Stochastics RSI, or StochRSI. In their 1994 book, The New Technical Trader, Tushard Chande and Stanley Kroll explain that RSI can oscillate between 80 and 20 for extended periods without reaching extreme levels. Notice that 80 and 20 are used for overbought and oversold instead of the more traditional 70 and 30. Traders looking to enter a stock based on an overbought or oversold reading in RSI might find themselves continuously on the sidelines. Chande and Kroll developed StochRSI to increase sensitivity and generate more overbought/oversold signals.

Click this image for a live chart
Basically, StochRSI is the Stochastic Oscillator applied to RSI. The chart above shows RSI in red and the Stochastic Oscillator (14,1,1) in black. The Stochastic Oscillator is added as an indicator to RSI using the "advanced options" on SharpCharts. The bottom indicator window shows StochRSI. Notice how StochRSI exactly matches with the Stochastic Oscillator of RSI. StochRSI is measuring the momentum of momentum. More importantly, there are many more overbought and oversold signals. For more, see our ChartSchool article on StochRSI.


