|
|
StockCharts users can measure the difference between Bollinger Bands by using the Bandwidth indicator. This nifty indicator shows chartists bandwidth as a percentage of the middle band, which is the 20-day SMA. There are two steps for calculation. First, subtract the lower band value from the upper band value. Second, divide this difference by the value of the 20-day SMA.
Low BandWidth values suggest that volatility is low and a consolidation may be forming. John Bollinger theorized that periods of low volatility are often followed by periods of higher volatility. This implies that low volatility does not last forever and a move is expected after a period of low volatility. Keep in mind that “low” is relative and one size does not fit all. Chartists should analyze BandWidth over a period of time to determine what exactly is low for a particular stock.

Click this image for a live chart.
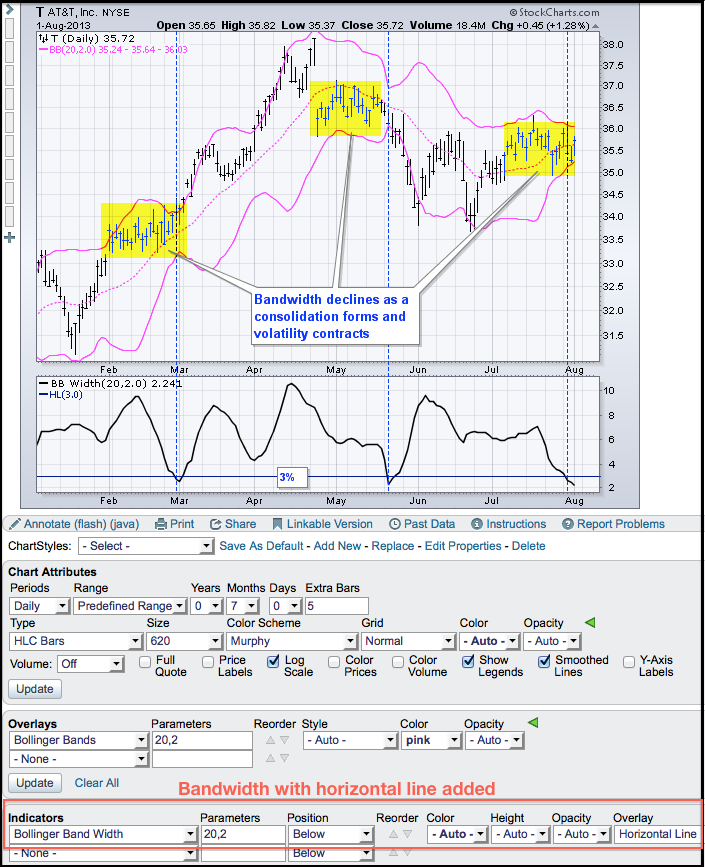
The example above shows AT&T (T) with Bollinger Bands and BandWidth. Notice that BandWidth dips below 3% are considered low. Also notice that consolidations (yellow areas) lead to volatility contractions and BandWidth declines. A move below 3% indicates low volatility and chartists should be on guard for a move (volatility expansion). Usually, the direction of the consolidation breakout provides the first directional clue. You can read more on BandWidth in our ChartSchool article.
Low BandWidth values suggest that volatility is low and a consolidation may be forming. John Bollinger theorized that periods of low volatility are often followed by periods of higher volatility. This implies that low volatility does not last forever and a move is expected after a period of low volatility. Keep in mind that “low” is relative and one size does not fit all. Chartists should analyze BandWidth over a period of time to determine what exactly is low for a particular stock.

Click this image for a live chart.
The example above shows AT&T (T) with Bollinger Bands and BandWidth. Notice that BandWidth dips below 3% are considered low. Also notice that consolidations (yellow areas) lead to volatility contractions and BandWidth declines. A move below 3% indicates low volatility and chartists should be on guard for a move (volatility expansion). Usually, the direction of the consolidation breakout provides the first directional clue. You can read more on BandWidth in our ChartSchool article.


