|
|
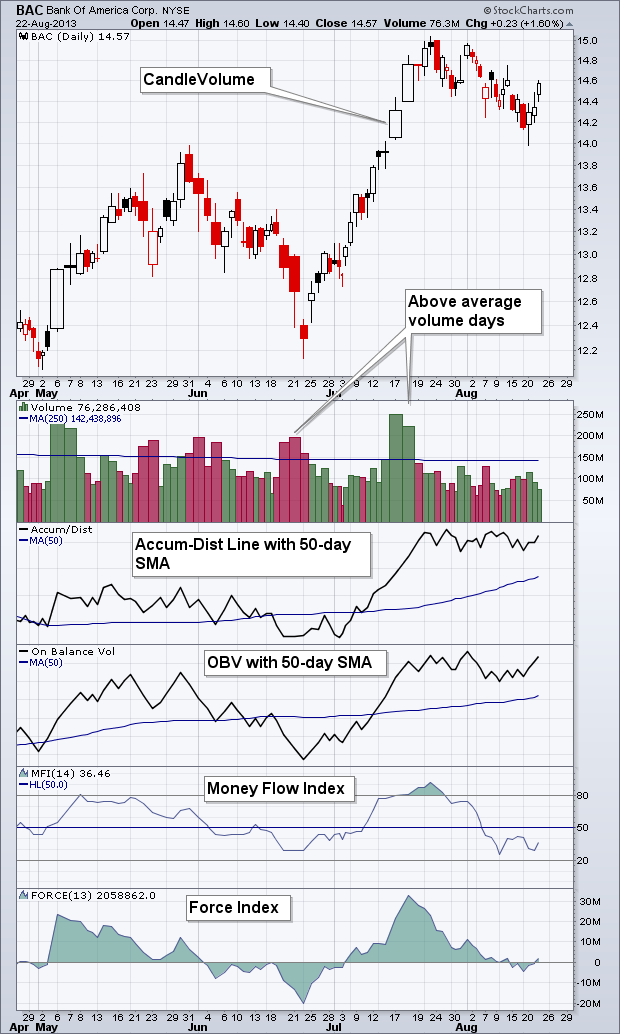
StockCharts offers two charting styles to track volume as well as several volume-based indicators to measure money flow, which is the flow of volume. First, chartists can set the chart “type” to Equivolume or CandleVolume to view volume right on the price chart. The width of the Equivolume boxes and CandleVolume candlesticks is based on volume. Wide boxes or candlesticks reflect high volume, while narrow ones indicate low volume. Second, chartists can add volume as an indicator and apply a 250-day moving average, which is about a year. Volume bars that exceed this moving average show above average volume, while volume bars that fall short show below average volume. The bars are red when the close is down, and green when the close is up.

Click this image for a live chart.
The indicator windows show four volume-based indicators. The Accumulation Distribution Line measures the close relative to the high-low range to define accumulation days and distribution days. A close above the mid point of the high-low range shows accumulation, while a close below the mid point shows distribution. On Balance Volume (OBV) using the close-to-close change to measure accumulation and distribution. Volume is added when the close is up and subtracted when the close is down. The last two volume-based indicators are oscillators. The Money Flow Index (MFI) indicates buying pressure when above 50 and selling pressure when below 50. The Force Index reflects buying pressure when positive and selling pressure when negative. You can read more on these indicators in our ChartSchool.


