|
|
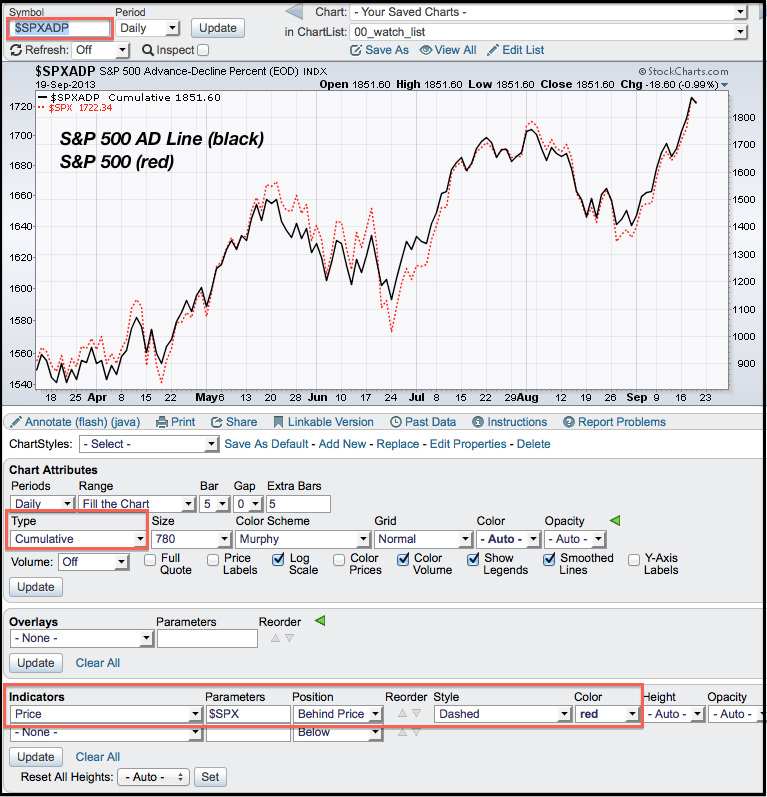
Chartists can easily create the AD Line for the S&P 500 using the SharpCharts workbench. This indicator starts with AD Percent, which is advances less declines divided by total issues. Note that StockCharts calculates AD Percent for dozens of indices and ETFs, including the nine sector SPDRs. Chartists first create a chart using S&P 500 AD Percent ($SPXADP). From this indicator, go below the chart and into the “Chart Attributes” section. Here chartists can change the chart “type” to cumulative. Chartists wishing to add the S&P 500 to the chart can do this by adding another indicator. In the indicators section, choose “price” and then type $SPX in the parameters box. The index can be positioned above, below or behind and main window. It is also easy to change the color and style of the line plot to insure it stands out. You can read more on the AD Line in our ChartSchool and you can click here for a SharpChart showing the AD Line.

Click this image for a live chart


