|
|
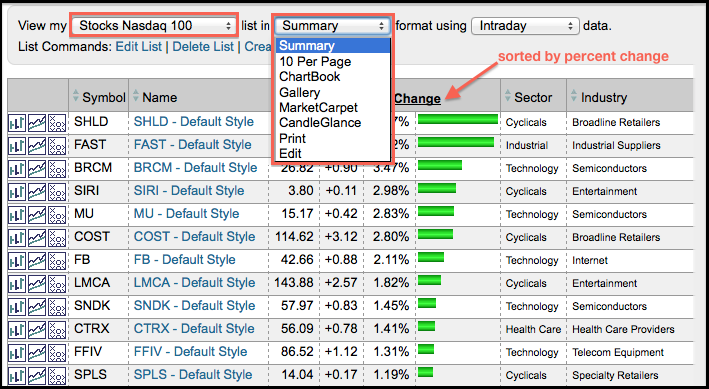
ChartLists are integral to getting the most out of StockCharts because these lists house our stocks, indices, ETFs and market indicators. ChartLists are not just lists though. StockCharts offers many different viewing options that make it easy for Chartists to quickly scan a group of stocks. The first image shows a ChartList for the Nasdaq 100 in “Summary” format, which shows the complete ChartList with various columns. Chartists can click a column headings to choose a specific sort. In this example, I sorted by “Percent Change” to put the biggest gainers at the top.

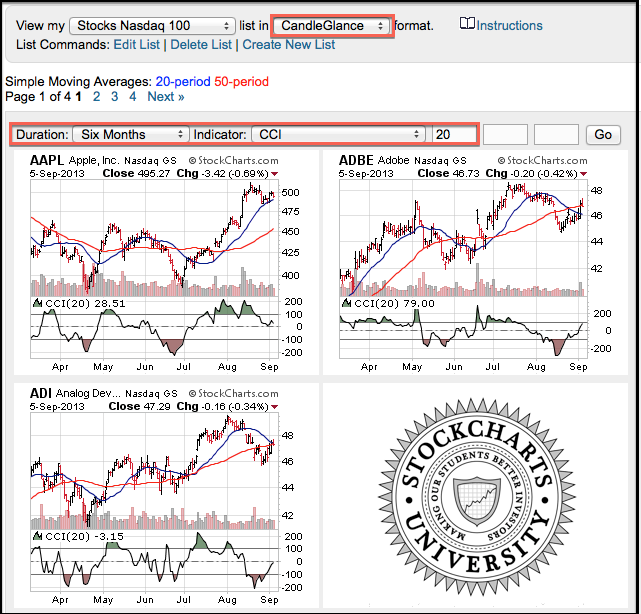
Chartists can choose a different viewing option by using the drop down menu at the top. The second example shows this same list viewed in CandleGlance format, which shows 30 small charts per page. Chartists can add indicators and change the timeframe using the dropdowns just above the CandleGlance charts. I love these little charts because they make it easy to scroll through dozens of charts in just a few minutes. Want to unleash the power of StockCharts? Check out our upcoming SCU seminar in New York (click here).

Click image for seminar details.

Chartists can choose a different viewing option by using the drop down menu at the top. The second example shows this same list viewed in CandleGlance format, which shows 30 small charts per page. Chartists can add indicators and change the timeframe using the dropdowns just above the CandleGlance charts. I love these little charts because they make it easy to scroll through dozens of charts in just a few minutes. Want to unleash the power of StockCharts? Check out our upcoming SCU seminar in New York (click here).

Click image for seminar details.


