|
|
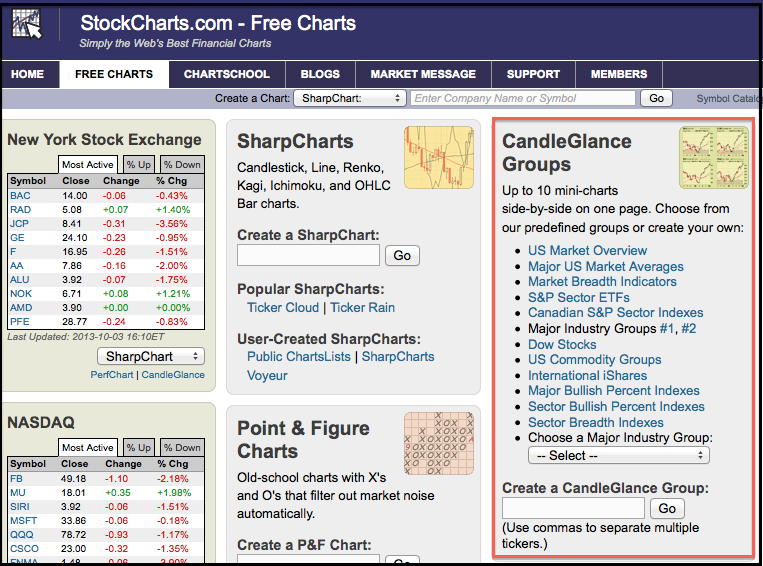
CandleGlance charts start with the CandleGlance groups on the Free Charts page. The appropriate links and dropdown menus can be found at the top of the third column. There are three options available. Chartists can click a link for one of the pre-defined groups, such as S&P Sector ETFs or Dow Stocks. Users can also choose from one of the major industry groups or enter a list of symbols to create a customized list.
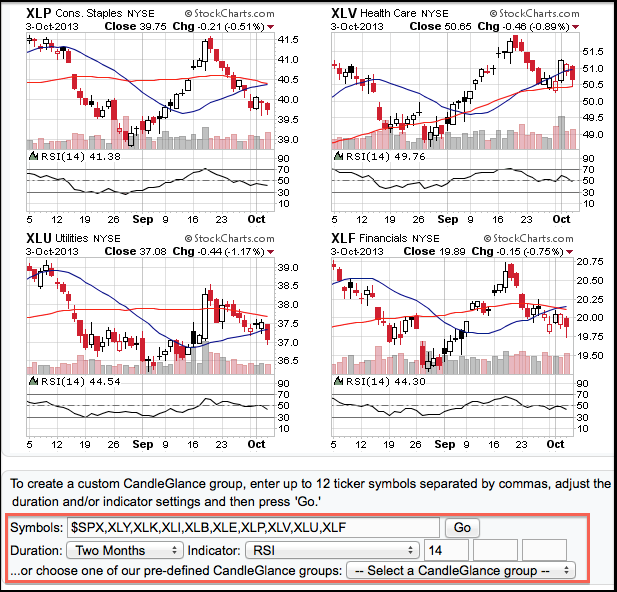
Once viewing the CandleGlance charts, chartists can add an indicator or adjust the chart duration by scrolling to the bottom and choosing an option. The duration can be set to two months, six months, a year or even P&F. Indicators, such as RSI and OBV, can be added with just one click. These CandleGlance functions make it easy to scroll through dozens of charts in just a few minutes.
Click this image for a live chart


