|
|
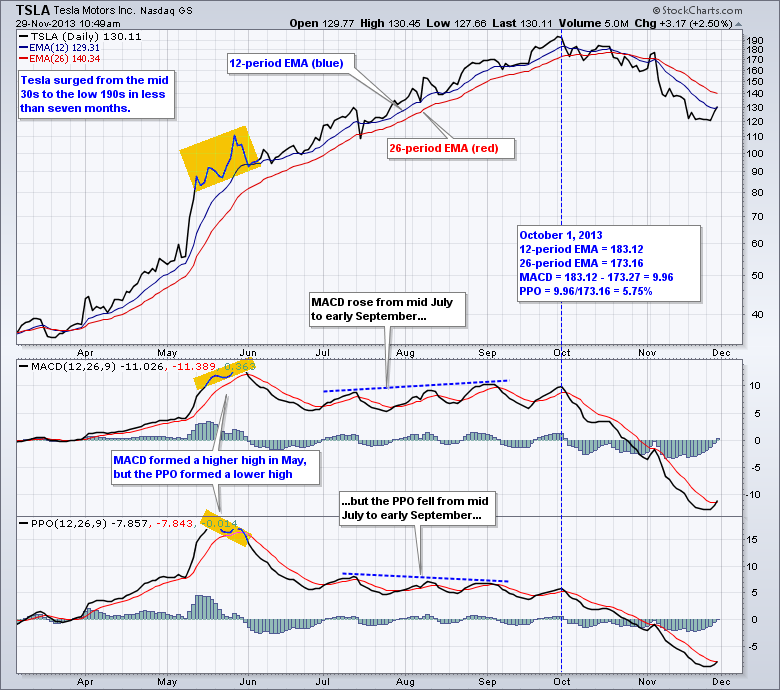
MACD and the Percentage Price Oscillator (PPO) both measure the difference between two moving averages, usually the 12-period EMA and the 26-period EMA. MACD measures the absolute difference, but the PPO measures the percentage difference by dividing this difference by the longer moving average. Even though these indicators usually track each other quite closely, differences will emerge when there are large price changes in the underlying security.
Click this image for a live chart
The example above shows Tesla (TSLA) with a big price move as the stock advanced from the mid 30s to the low 190s in less than seven months. This 160 point gain (~450%) affected MACD and the PPO. After a decline in June, MACD continued to drift higher because the absolute difference in the moving averages remained high. The PPO, on the other hand, drifted lower because the “normalized” difference fell. As the calculation example for October 1st shows, the PPO divides the MACD value by the value of the 26-period EMA to show the difference in percentage terms, which makes it more comparable over time. While there is nothing wrong with MACD, I think the PPO provides a more robust picture of price momentum. You can read more about these indicators and many others in our ChartSchool.


Posted by: Robert Wiesinger December 03, 2013 at 22:19 PM